The Lumi AI Glossary
Enabling Merchandising Teams to Analyze Sales Data Independently
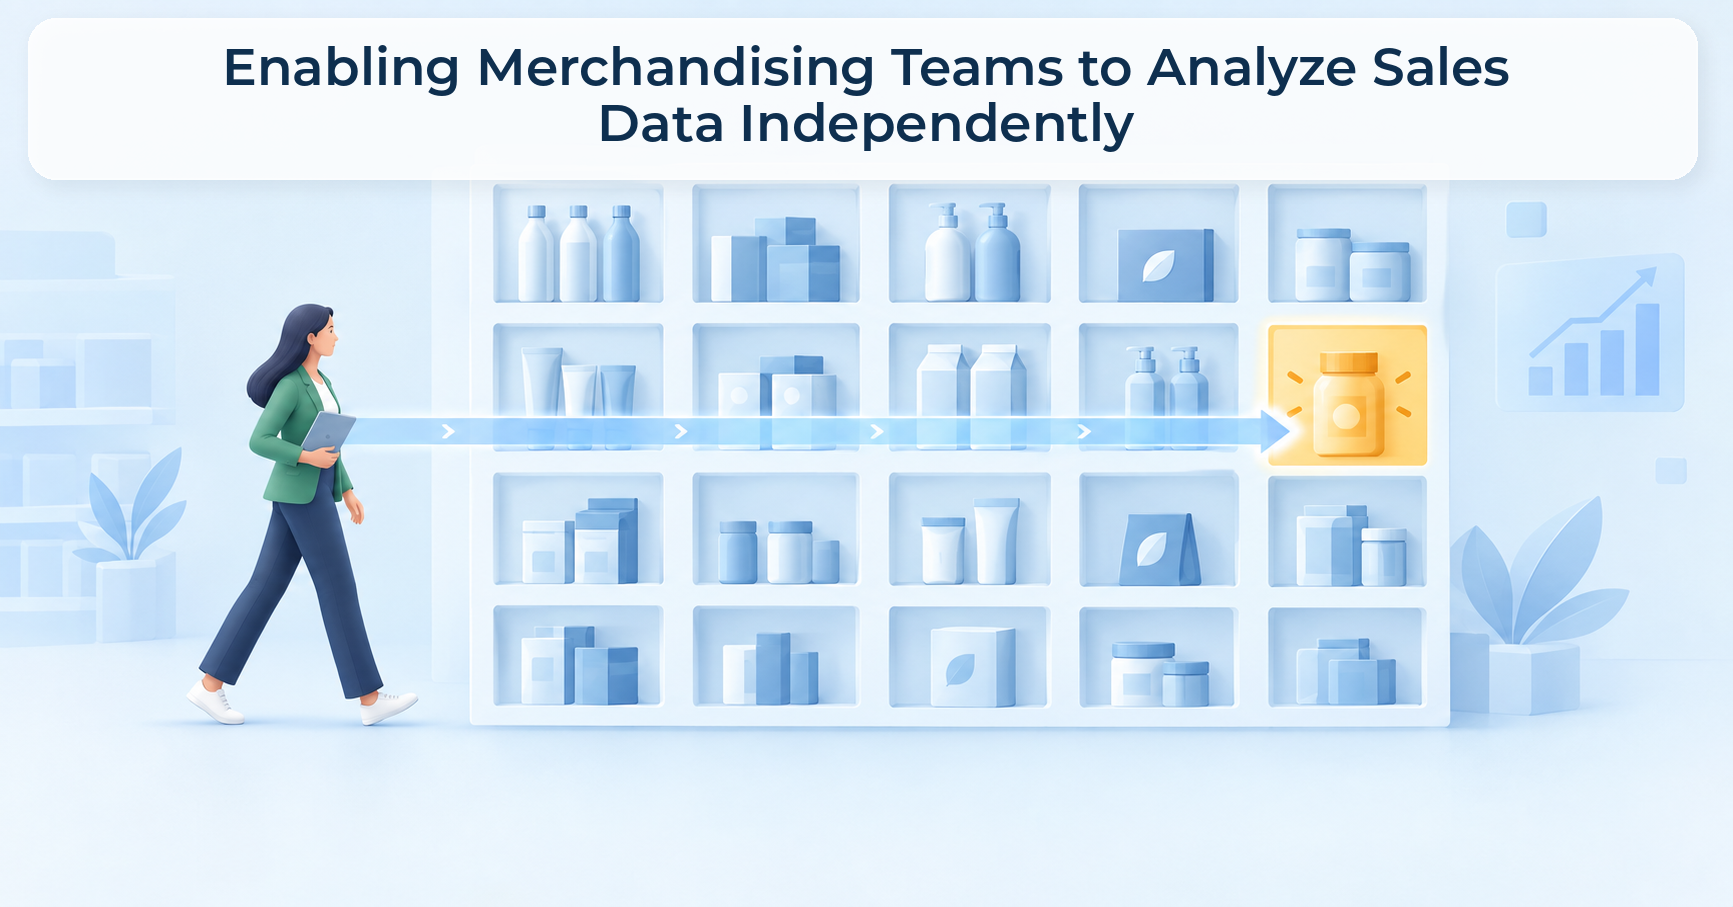
A merchandising team is running independently when a category manager can ask a question about sell-through, margin, or basket mix and get a trustworthy answer in minutes, with no ticket, no SQL, and no wait for someone else's sprint to clear. That is the bar this article measures tools against.
Most "self-service" tools fail it quietly. They still need someone technical to set them up before a category manager can ask a real question. This article covers what genuine independence requires, what gets in the way of it today, and how to evaluate whether a platform actually delivers it or just looks like it does in a demo.
Why Merchandising Teams Still Wait on Data Teams
It's Monday morning. A seasonal line launched Friday, and a category manager wants to know which stores are underperforming. That's not a complicated question. But getting an answer means submitting a ticket to the BI team, waiting three days, and making the actual decision on gut feel before the report ever lands.
The lag isn't a data problem. The data is already sitting in the ERP. The lag is a configuration problem: most enterprise analytics tools are analyst-configured tools wearing a business-user interface. Before a category manager can ask a single question, a data engineer has to connect the sources, a BI developer has to build the semantic model, and someone has to pre-define every metric the tool will recognize.
The result is what the industry calls dashboard anarchy: hundreds of dashboards built for questions someone anticipated months ago, and a merchandising team that still can't get an answer to the question they actually have right now.
SKU rationalization, price elasticity, and basket penetration studies routinely run across millions, sometimes billions, of sales and inventory transactions at a time. Historically, that kind of analysis required SQL or Python fluency, a skill set most merchandising teams were never hired for and shouldn't need to develop just to do their job.
What "Independent" Actually Means
Independence is a specific, testable thing, not a marketing word. A tool clears the bar when a category manager can ask "which SKUs had the lowest sell-through last month by region?" and get a chart in seconds, with no ticket, no SQL, and no wait for a scheduled report.
Three criteria separate genuinely independent tools from tools that only look independent:
- Natural language input, no SQL required. The team asks the question the way they'd ask a colleague, not the way they'd write a query.
- The tool understands merchandising language, or lets the team define it. "Sell-through," "halo SKU," and "KVI" need to mean something the platform already knows, or something the team can teach it themselves, without opening a ticket.
- It connects to existing systems without a data engineering project. If plugging in the ERP or point-of-sale feed consumes most of an engineering team's sprint before anyone can ask a question, the tool hasn't removed the bottleneck. It's moved it earlier.
That third criterion is where most evaluations stop looking, and it is the one worth testing hardest. It also points at something easy to miss. Self-service analytics is not a feature a vendor adds to an existing BI tool. It is a decision about who the product is built for, made long before the demo, and it shows up in how much setup work the tool quietly assumes a data engineer will do.
The Question Nobody Asks Before Buying
Here's the test that separates real independence from a good demo: can the merchandising team add their own definitions, metrics, and terminology without a data engineer?
If adding a new KPI definition requires filing a ticket, the tool is not genuinely self-service. The dependency on the data team didn't disappear, it just moved from "build me this report" to "configure this tool so I can ask my own questions." Either way, the category manager is still waiting on someone else's calendar.
A platform's knowledge management layer is where this gets decided. If business users can open that layer and define a term, a metric, or a KPI themselves, independence is real. If that layer is only editable by IT, the tool has simply relocated the bottleneck rather than removed it. Anthropic has published its own account of what happens when this layer isn't actively maintained by someone: internal analytics accuracy climbed from roughly 21% raw to 95%+ once a proper semantic layer was built, then fell to 65% within a month once nobody kept tending it. The lesson generalizes past Anthropic's own use case. A semantic layer that only a data engineer can touch will drift the moment the business changes and that engineer is busy with something else.
What Day-One Usability Actually Looks Like
Independence isn't only about who can edit definitions. It's also about how fast a team gets from "we just connected our data" to "we're asking real questions and trusting the answers."
Traditional BI platforms with data-team-managed semantic layers can take three to six months to reach that point, because someone has to model the schema, map every metric, and test the results before a business user ever sees the tool. Retail and CPG teams using conversational analytics built for operational data are typically live and running real questions within about a week of connecting their systems, a timeline that comes from the platform being purpose-built for ERP, inventory, and sales data rather than from novelty.
That gap, months versus about a week, is the practical difference between a tool that promises independence and one that delivers it on day one.
The Tools Merchandising Teams Compare, and Where Independence Actually Lives
When merchandising teams shortlist analytics tools, the same names come up: ThoughtSpot, Sigma Computing, Microsoft Power BI with Copilot, Omni Analytics, and Lumi AI. Each is a capable product. They differ sharply on how much of the independence bar above they actually clear.
A few of these are worth a closer look, because the differences matter for the independence question specifically, not as a general feature comparison.
ThoughtSpot works best when an organization already has a well-governed data model behind it. The search interface queries whatever schema the data team has already built. That's a strength for organizations with mature governance, and a harder fit for a team trying to bypass the data team's queue entirely. A fuller side-by-side comparison is worth reading if ThoughtSpot is already on your shortlist.
Sigma Computing looks and feels like a spreadsheet, which reduces onboarding resistance for teams comfortable in Excel. The tradeoff is domain specificity. There's no built-in retail context, so a merchandising team is still working with column names and warehouse schema rather than the language they actually use.
Power BI with Copilot is the "we already have it" option, and it's a capable platform when a BI team actively maintains the model underneath it. But "we already have it" is not the same claim as "merchandising can use it independently." The analyst dependency doesn't disappear, it moves upstream into ongoing model maintenance.
Omni Analytics is flexible across technical and non-technical users, but it doesn't take a plain-language question and turn it into an answer the way a conversational, agentic platform does. A category manager still works through a workbook interface. That's friendlier than raw SQL, but it's not the same as asking in plain text and getting a chart back.
What Independence Looks Like in Production
Kroger used Lumi to de-average and re-aggregate sales and inventory data down to the store-item level, surfacing millions of units in unfulfilled demand, an analysis that would otherwise require hours of manual, analyst-driven work. Chalhoub Group used the platform to identify $60 million in additional revenue opportunity by driving in-store purchases. These are Lumi's own reported figures rather than independently audited results, and worth asking about directly during any evaluation, but they illustrate the kind of question independence is meant to unlock: not a lookup, but an open-ended investigation a merchandising team runs on its own.
The same pattern shows up in the specific questions merchandising teams ask once they're not waiting on a ticket queue: SKU rationalization decisions on which items to keep, review, or cut; halo item protection so a low-selling SKU that drives basket size doesn't get delisted by mistake; KVI pricing checks; localization by store cluster; and basket penetration and basket analysis. These questions routinely span millions or billions of transactions, exactly the scale where manual, spreadsheet-driven analysis breaks down and a properly connected query interface becomes the difference between a question asked and a question answered.
Building this same kind of independent analysis into ongoing customer and sales analytics work, rather than treating it as a one-off project, is what keeps a merchandising team asking new questions instead of returning to the old ticket queue six months later. If your team is building the internal case for a new tool, Lumi's guide to AI-driven category management covers the shift in more depth, and its buyer's guide to self-service analytics without SQL sets out a more general evaluation framework.
How to Test Independence Before You Buy
Don't take a vendor's word for any of this. Test it directly, against your own data, before committing.
- Ask the tool your actual messiest question, on your actual data, not a cleaned-up demo dataset. Open-ended, multi-part questions are where platforms separate; Lumi 3.0 is built to work through that kind of question in a single run, comparing outputs as it goes rather than stopping at the first query that matches the words in the prompt.
- Try to add a new metric or term yourself, without opening a ticket to IT, and time how long it takes.
- Ask the same question two different ways and check whether the answer stays consistent. Consistency across phrasings, not one-off correctness, is the measurable readiness test worth applying: the same intent should return the same figure regardless of who asks or how they word it.
- Ask how long it took a comparable retail or CPG team to go from "data connected" to "asking real questions."
- Ask what happens when your business changes, a new product line, a reorganized territory, a redefined metric, and whether the platform's understanding updates or quietly goes stale.
If a vendor can't answer all five clearly, you're evaluating a demo, not the tool your team would actually use.
FAQ
Can merchandising teams really analyze sales data without any SQL or coding knowledge?
Yes, but only if the tool is built for it from the ground up. Look for a natural language interface that either comes pre-configured for retail and operational data, or lets the team define its own terminology without technical help.
What's the difference between a BI dashboard and genuine self-service analytics?
A dashboard shows what someone else decided was important, on a schedule someone else set. Genuine self-service analytics answers the specific question a merchandising team has right now, without a technical intermediary.
How long does it take to get a merchandising team running independently on a new analytics platform?
Traditional BI platforms with data-team-managed semantic layers can take three to six months. Platforms built to connect directly and let the business team define its own terminology can have a team asking real questions within about a week.
What kinds of questions should a merchandising team be able to ask on its own?
SKU rationalization, halo item protection, KVI pricing checks, store-cluster localization, basket penetration, and sales, margin, and revenue breakdowns, often across millions or billions of transactions at once.
Does buying a self-service tool remove the need for a data team entirely?
No. It removes the data team from the path of every individual merchandising question. The data team's time shifts toward higher-value work instead of fielding ad hoc report requests.
What's the single best test of whether a tool delivers real independence?
Whether a business user can add their own metric or term to the platform without filing a ticket. If that still requires engineering help, the dependency hasn't gone away, it's just moved.
Try It on Your Own Data
The fastest way to know whether a platform delivers real independence is to run your team's actual, messiest question against your own data, not a vendor's sample dataset. That is the kind of open-ended, multi-step question Lumi 3.0 was built for. Schedule a demo with Lumi AI to see how a merchandising team goes from connected data to an answered question, on its own, without a ticket in between. Review Lumi's pricing for deployment options once you've tested the platform against a question that actually matters to your team.

Data & AI Products | Founder & CEO at Lumi AI | Ex-Director at Unicorn. Ibrahim Ashqar is the Founder and CEO of Lumi AI, a company at the forefront of revolutionizing business intelligence for organizations with a specialization in the supply chain industry. With a deep-rooted passion for democratizing data access, Lumi AI seeks to transform plain language queries into actionable business insights, eliminating the barriers posed by SQL and Python skills.
Related articles
The New Standard for Analytics is Agentic
Make Better, Faster Decisions.