Stunning Visualizations Built for
Real Operations
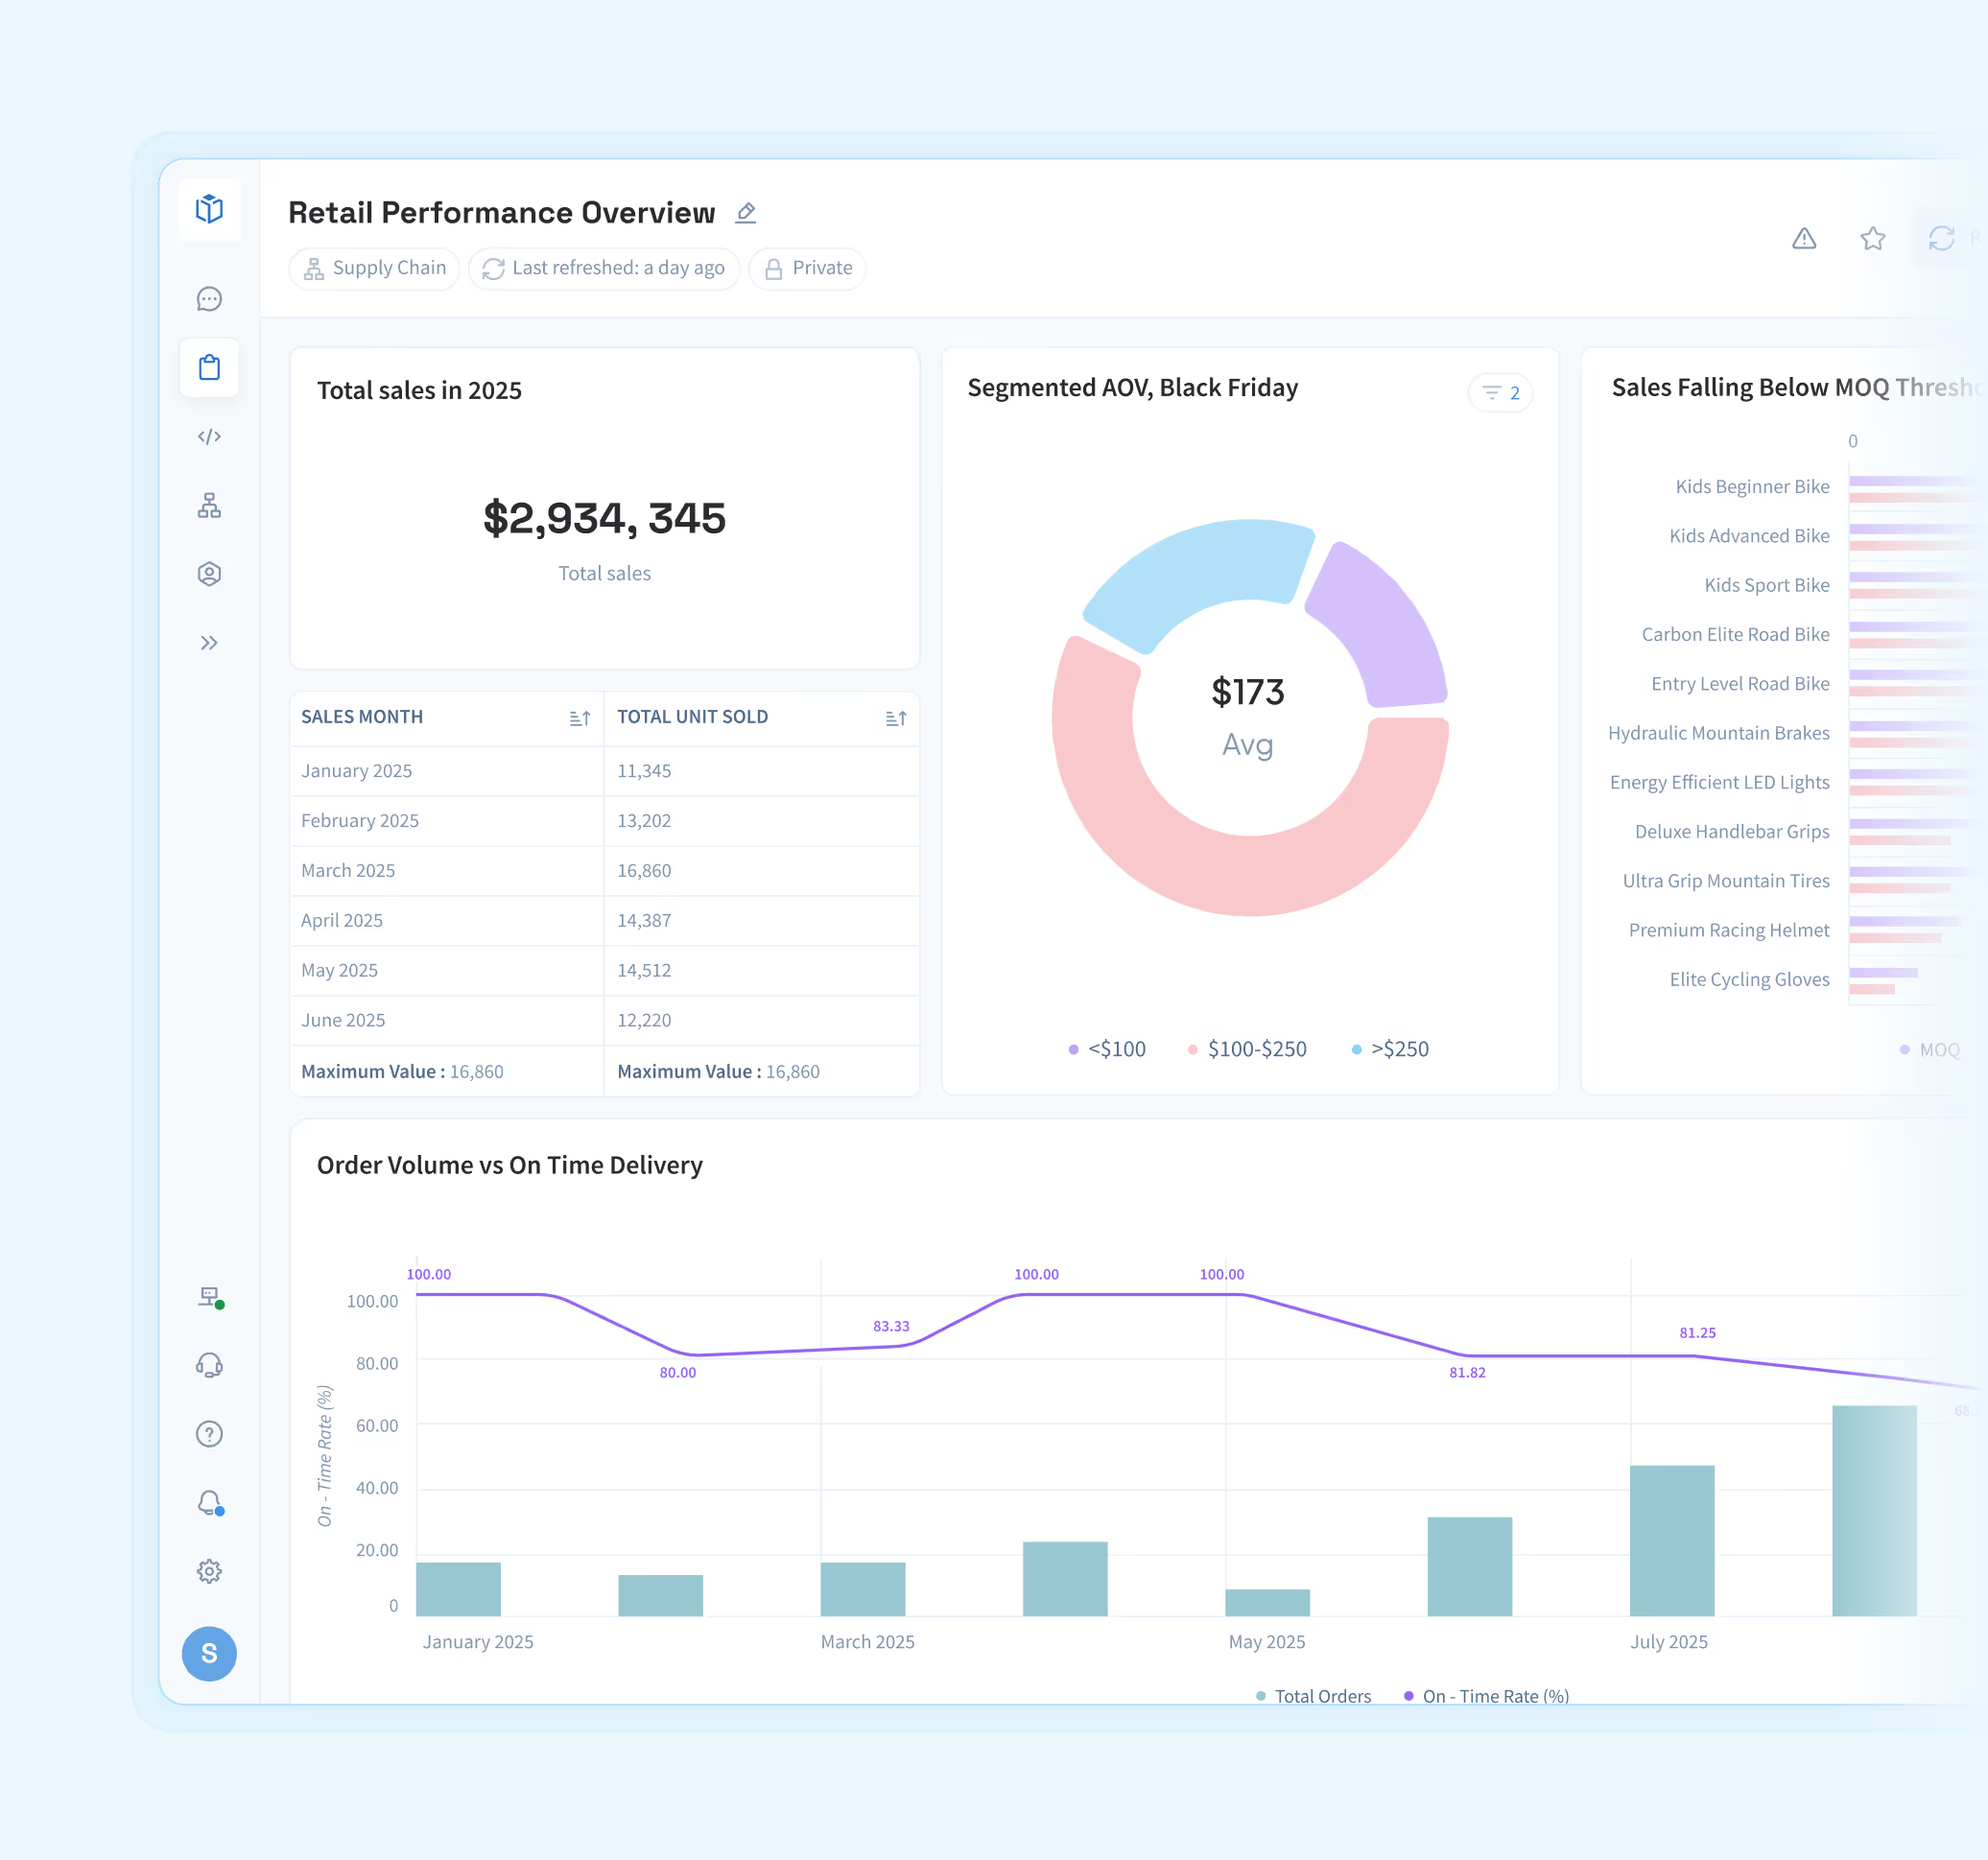
Lumi Visualizations turns value-chain data into clear, actionable views that help teams understand performance and act with confidence.
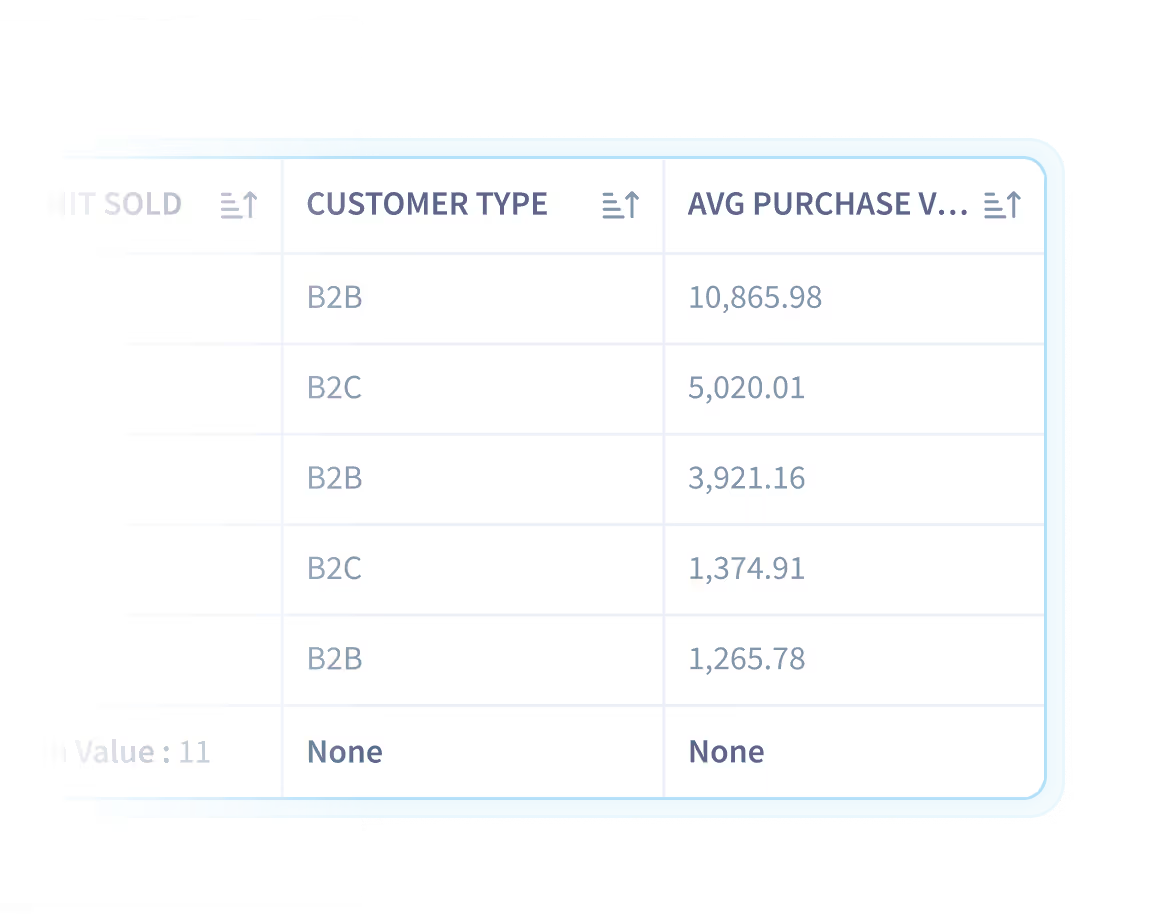
Lumi’s ability to de-average and re-aggregate down to store-item impacts makes it far more efficient.

It was obvious during the pilot that Lumi could take care of a lot of the challenges. You could just ask.
Lumi identified $60M in additional revenue by targeting customers most likely to shift to higher AOV transactions.

Calibrated For Intuitive Communication
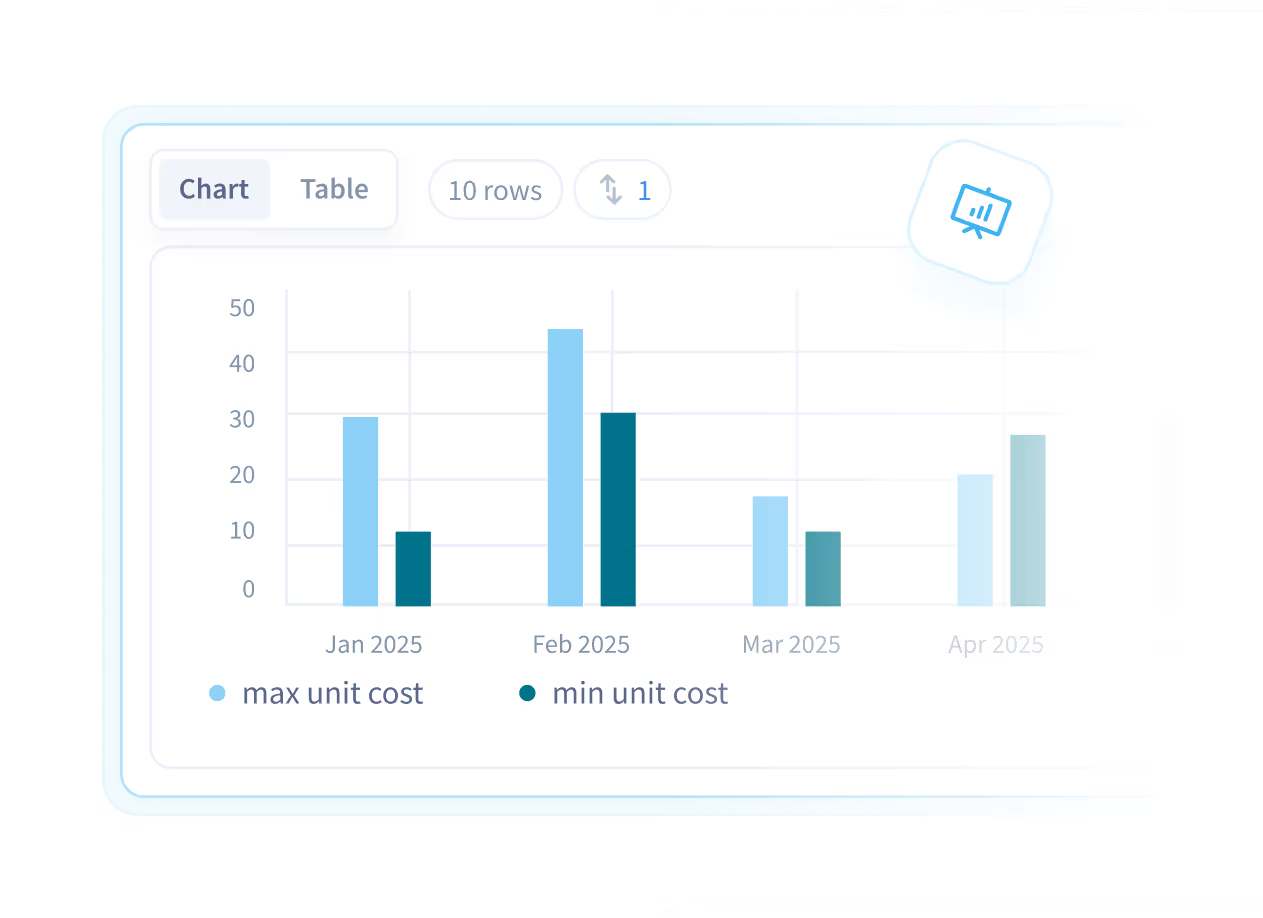
Generate elegant visuals to get your message across right in the flow of analysis. Your teammates can explore and drill down with ease.
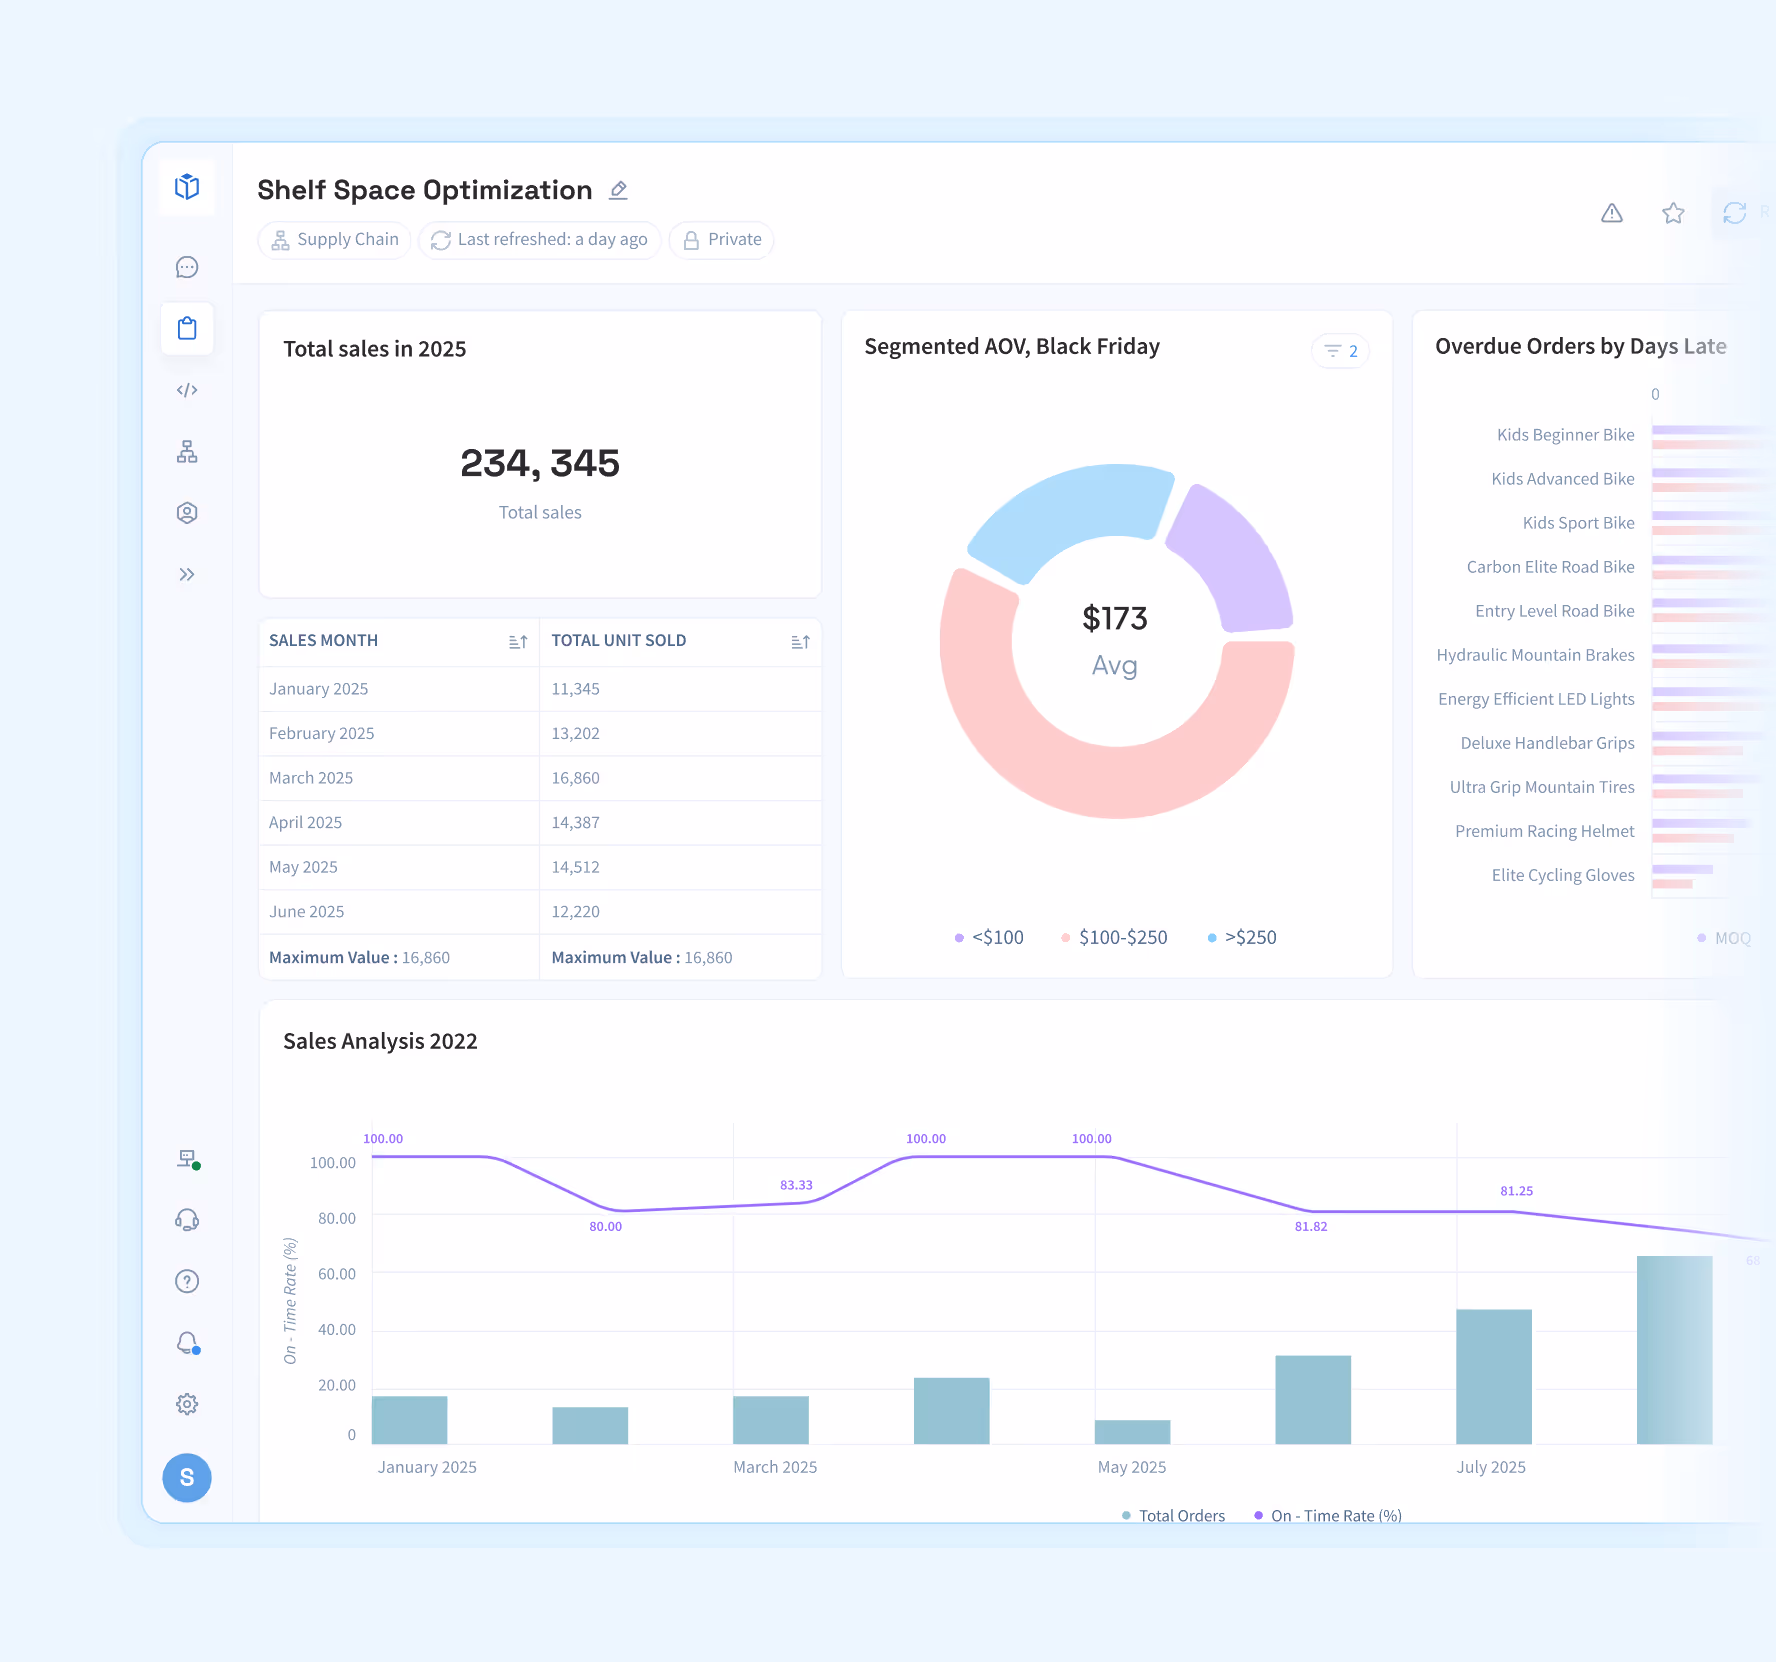
Combine visualizations into boards that reflect how the business operates.
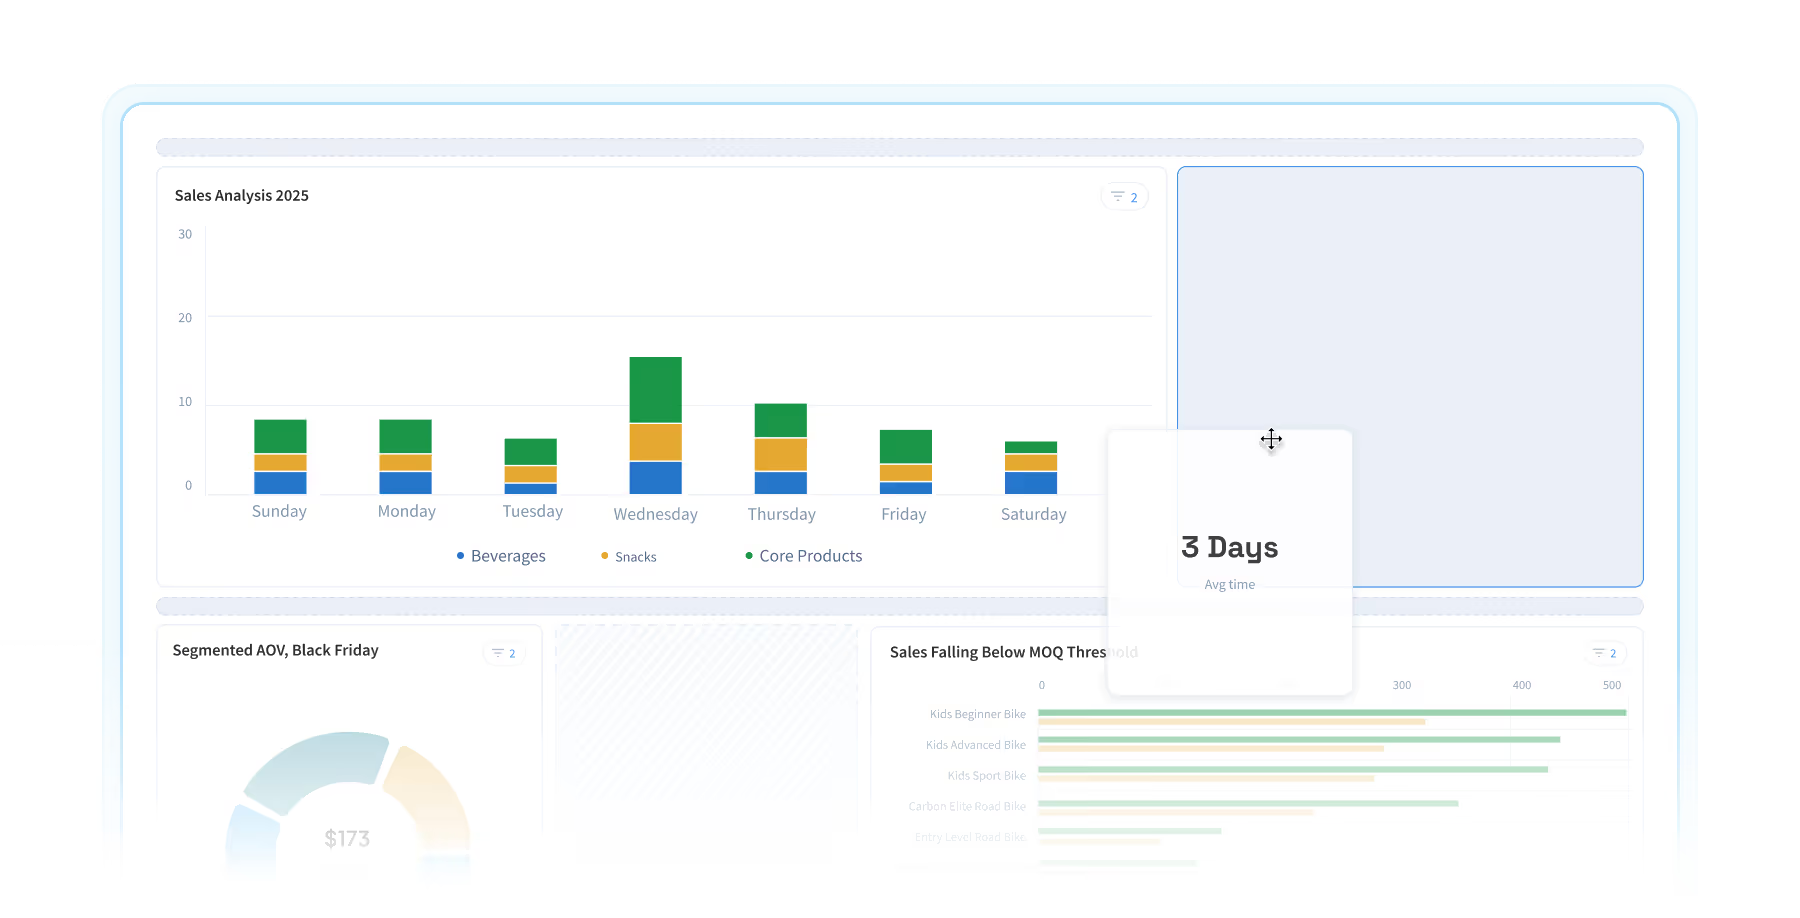
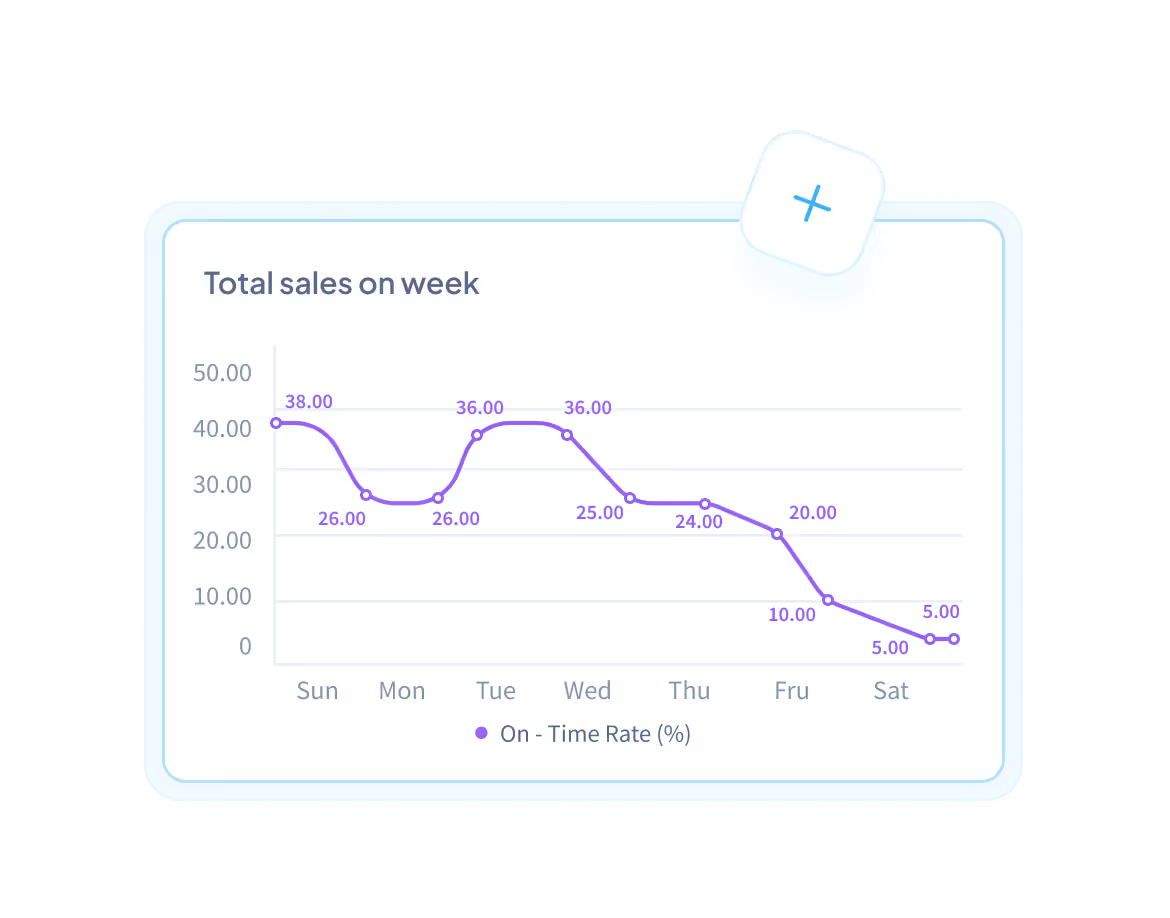
Lumi creates line charts, bar charts, comparisons and other views the moment they are requested.
Share boards so every team works from the same definitions and view of performance.
Follow inventory flow, cost changes, margin movement and demand variation in one place.
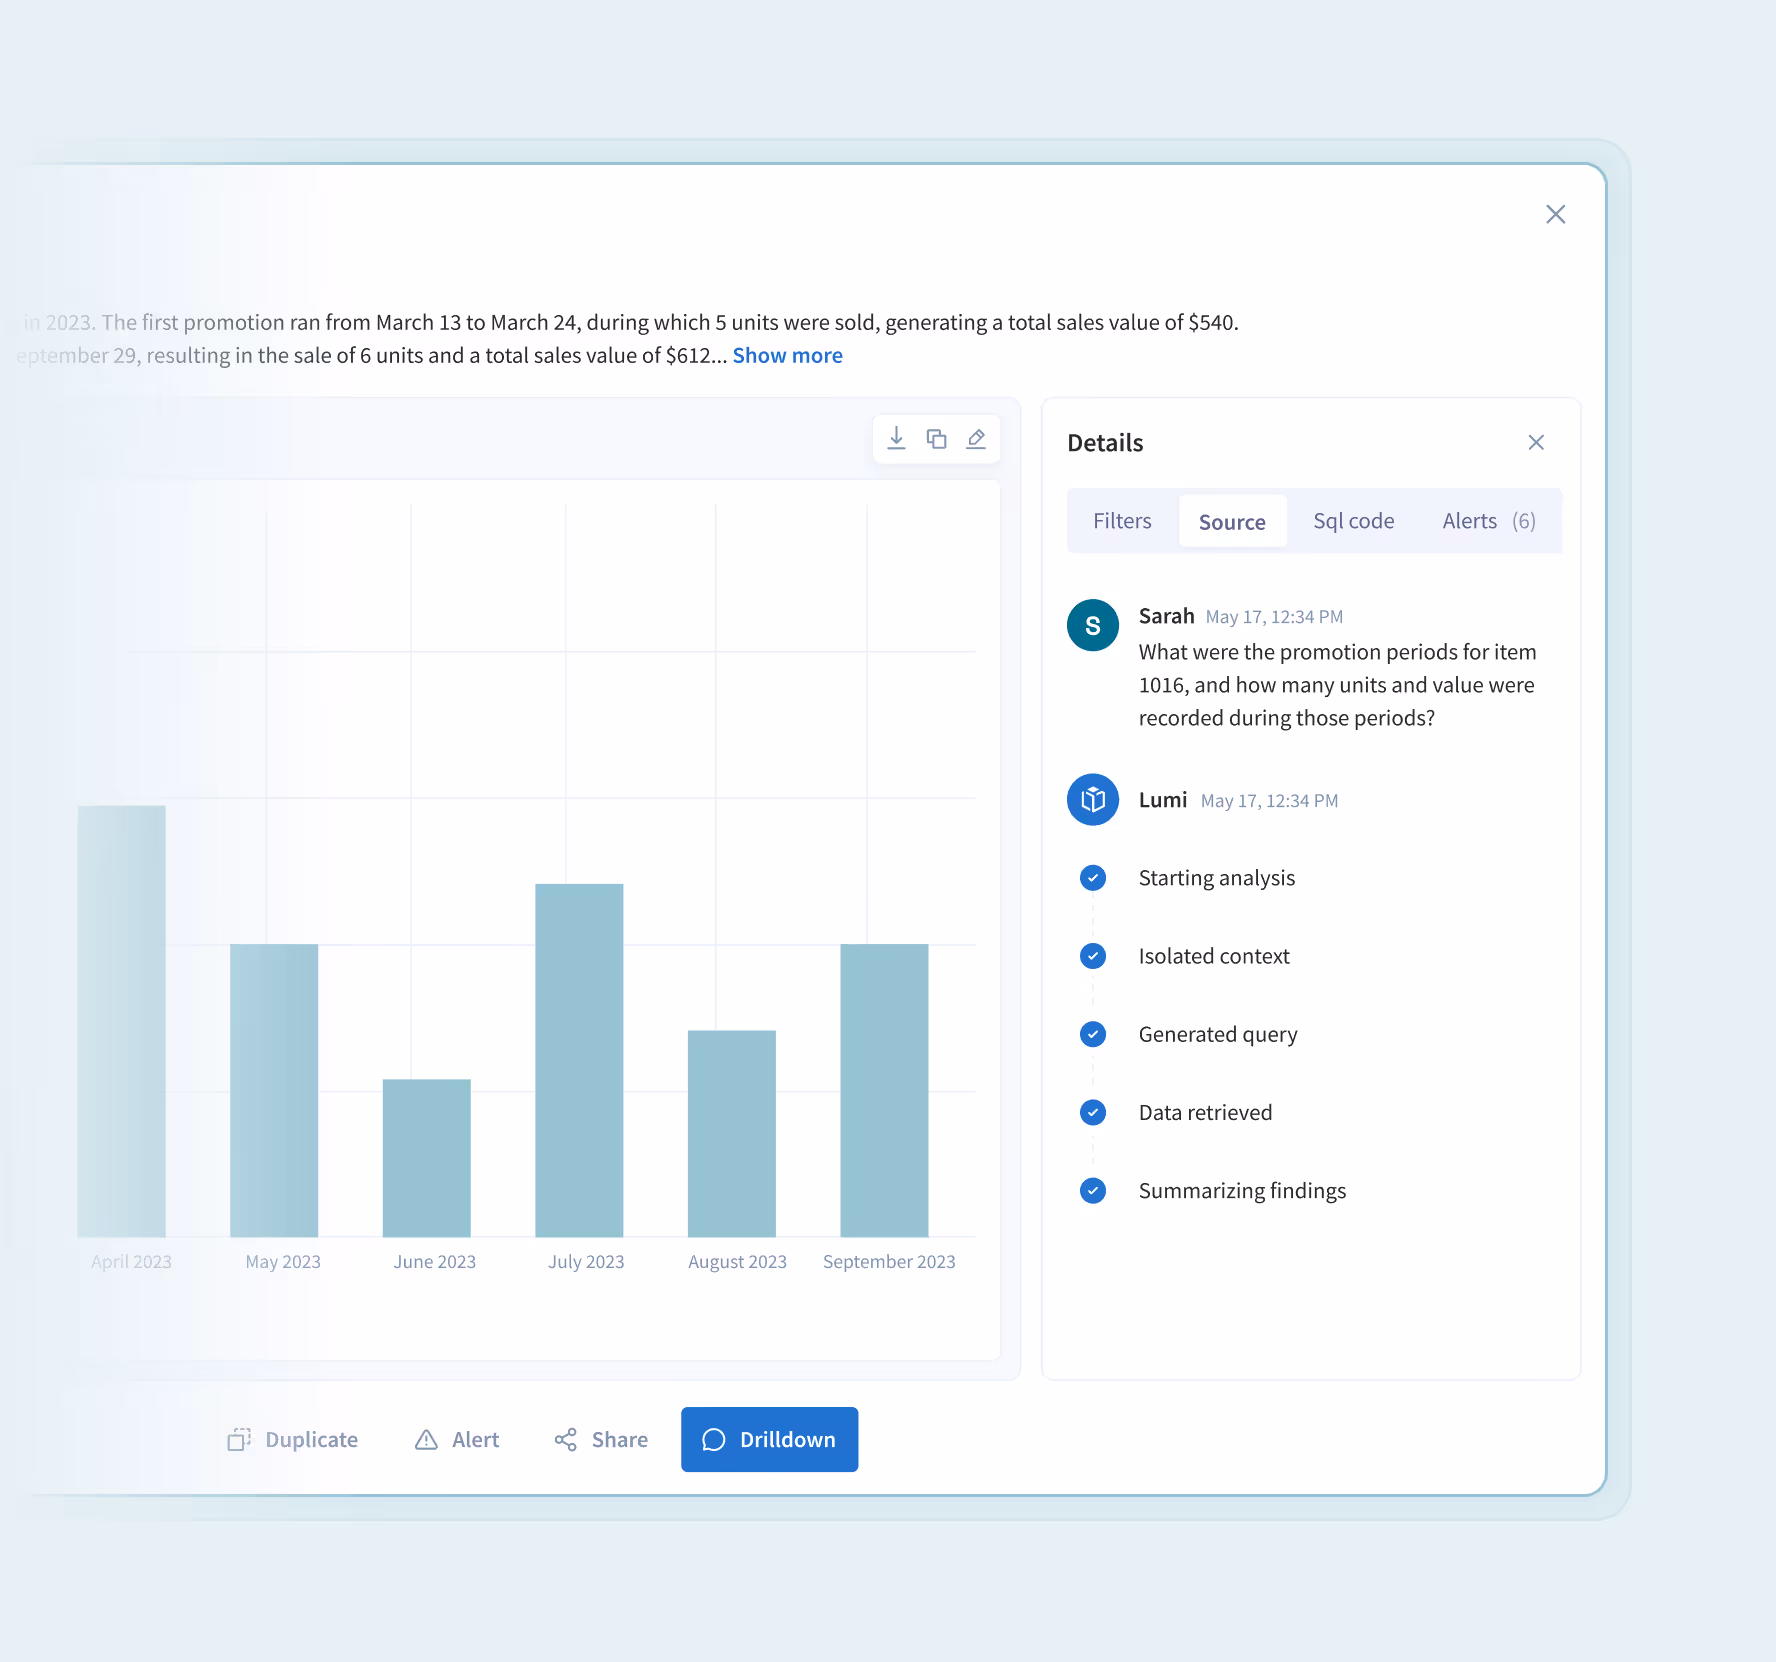
Drill into products, suppliers, regions or periods to understand where performance is moving.
A Single Insights Workspace for Complex Data Operations
Boards surface the charts and metrics teams rely on, giving a clear view of performance the moment they open the page.


Each insight persists with its logic and source data. Teams can revisit prior work, refresh results, or extend analysis without starting over.


Every board supports drill downs. Teams can compare periods, trace movement, or inspect underlying data as questions arise.


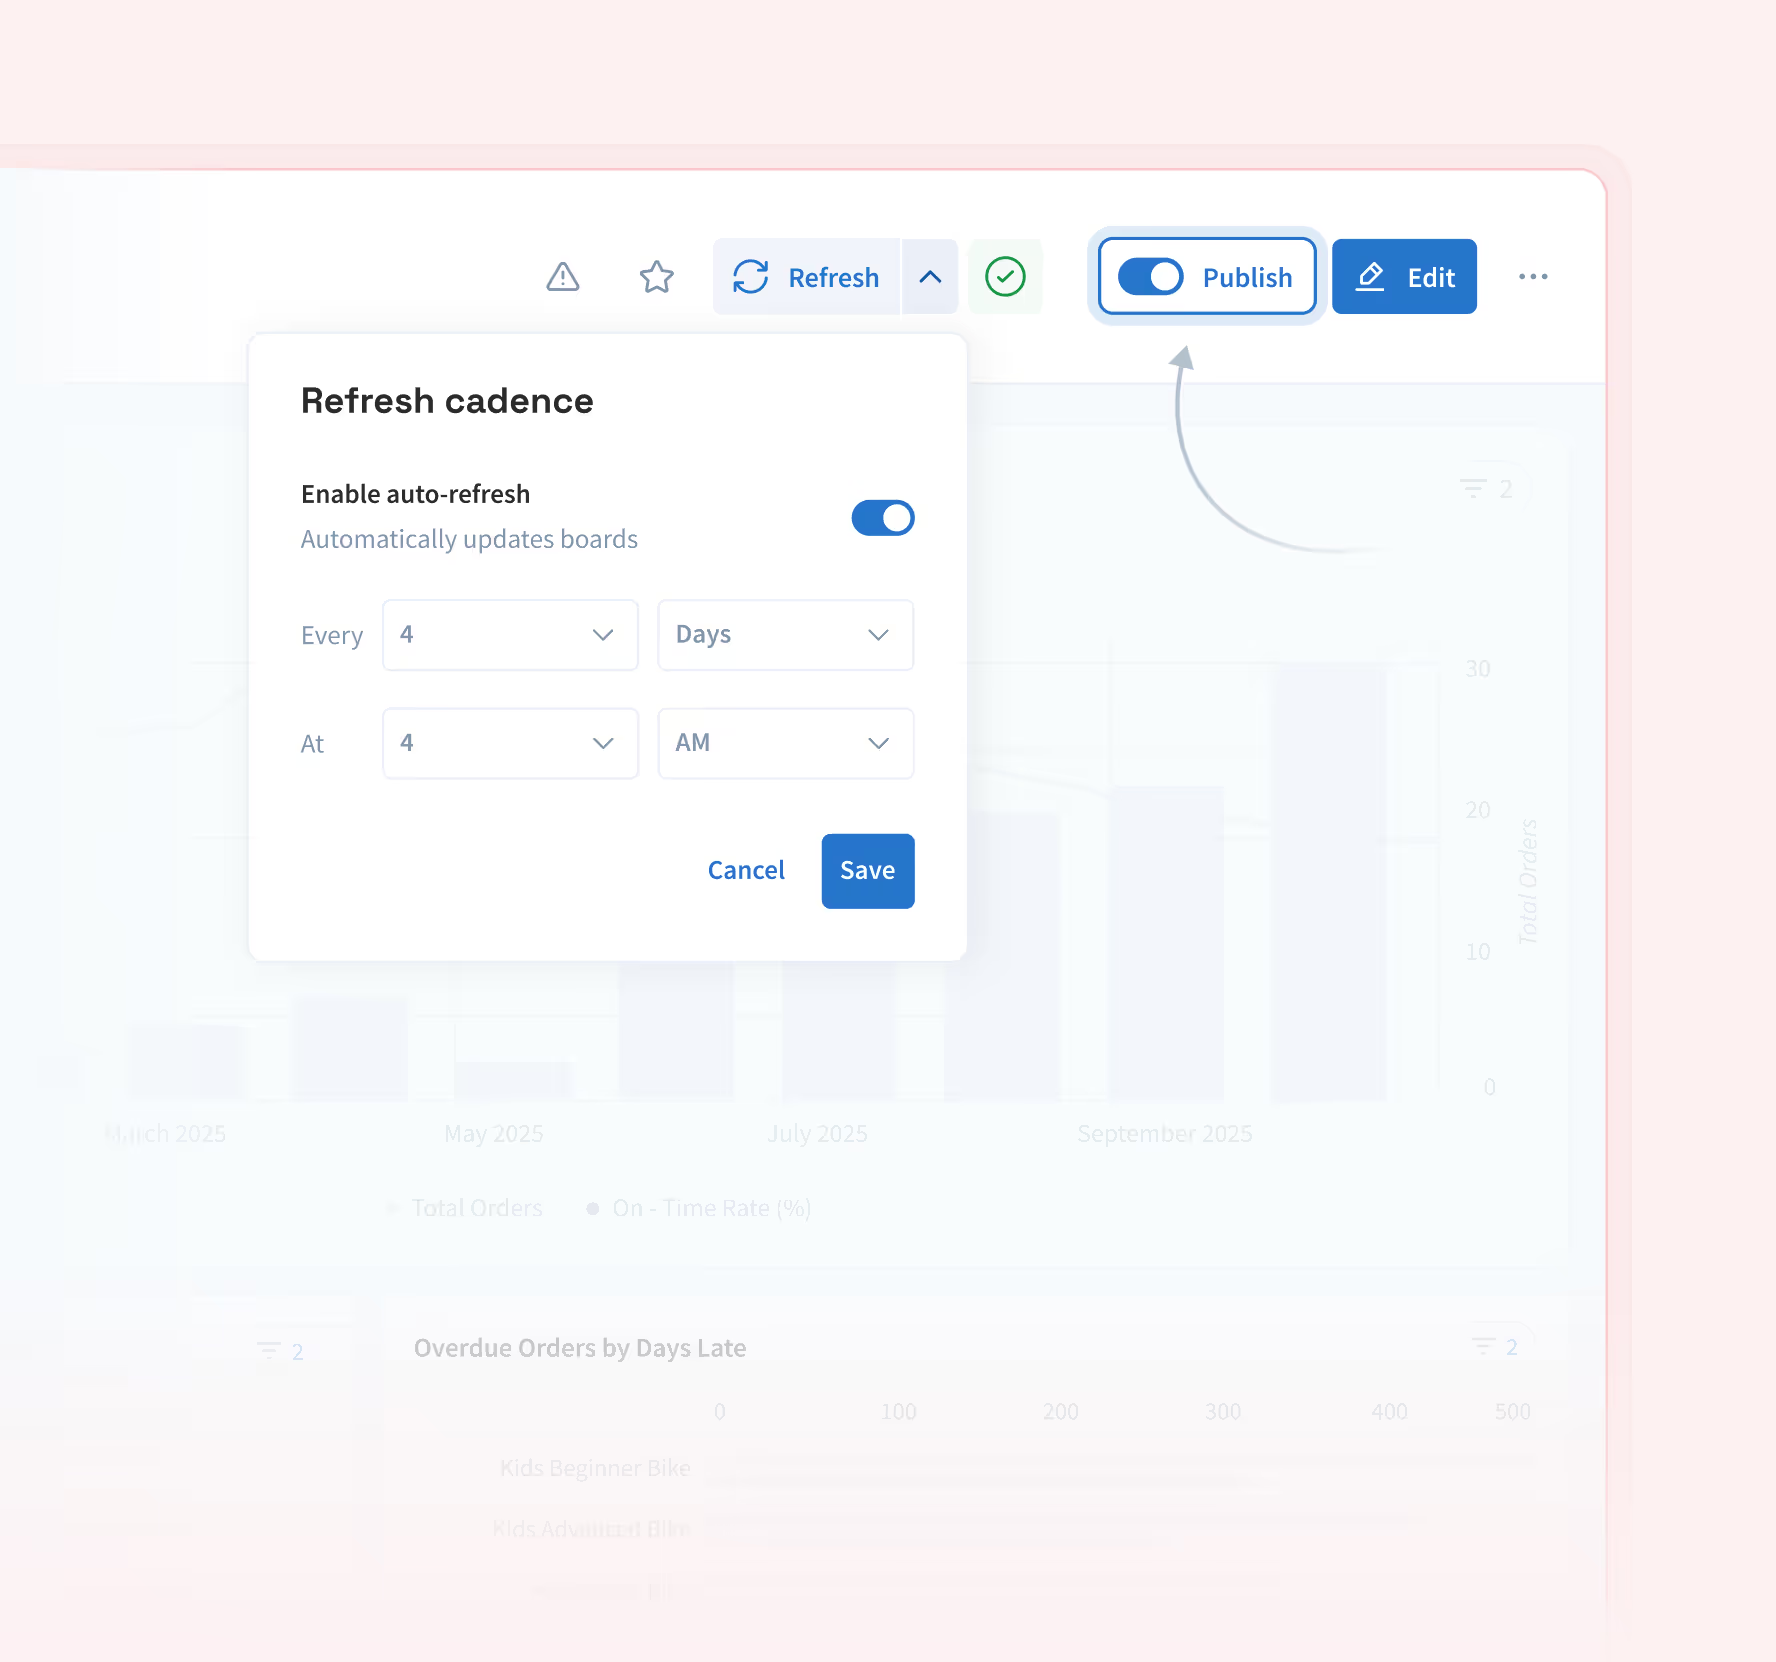
Boards can be shared across teams with consistent definitions. Data refreshes on command, and alerts surface changes that need attention.
Say Goodbye to Dashboard Anarchy
Embrace the future of Business Intelligence
Save results from exploratory questions and retain them as structured artifacts for ongoing use.
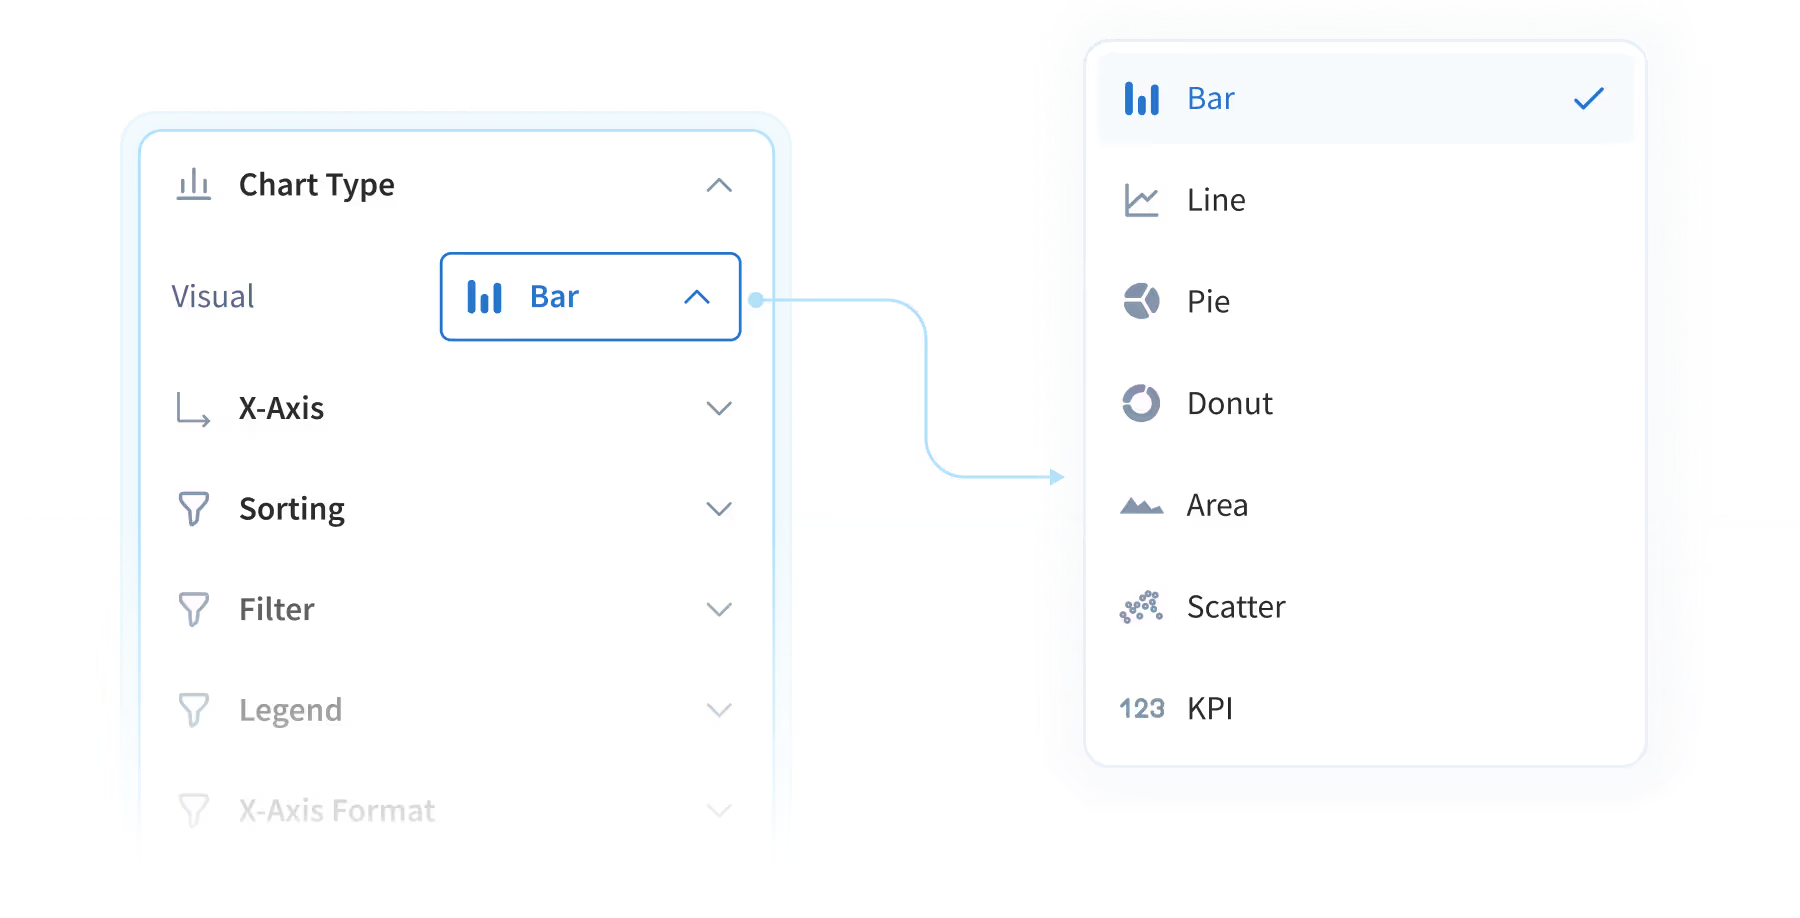
Lumi selects the most appropriate visual based on the structure of the question and the data returned.
Refresh boards on demand or on a set cadence to reflect current conditions.
Set alerts on key metrics so teams are notified when performance shifts.
Each card shows how metrics are defined, including code and assumptions, so teams can review and trust results over time.
Boards query data directly so results reflect current conditions without delayed data pipelines.
Adjust chart types, colors, filters, and more. Modify views as review needs change, without recreating analysis.
Boards are created directly from questions and existing data sources, without setup work or dashboard requests.
Lumi Thinks And Acts Like Your Best Data Analysts
Lumi's agentic workflows can answer a variety of questions, from simple queries to vague prompts and complex root cause analysis, all while interpreting business-specific language.


.avif)
The New Standard for Analytics is Agentic
Make Better, Faster Decisions.

