
Back to blog
Back to Case Studies
How to Perform Market Basket Analysis


Market Basket Analysis with Lumi
Market basket analysis is a powerful tool in retail analytics, helping teams uncover purchasing patterns and optimize product promotions, and bundling strategies. In this guide, we’ll walk through Lumi's approach to basket analysis using natural language and AI-powered insights.
Watch the Full Walkthrough
In this video, we demonstrate how Lumi enables fast, intuitive basket analysis with real-time queries and contextual breakdowns.
What is Basket Analysis?
Basket analysis examines customer transactions to identify relationships between items frequently purchased together. By uncovering these patterns, retailers gain insights that help increase basket size, boost order value, and ultimately drive revenue growth. Basket Analysis allows retailers to:
- Design effective bundles. Products that frequently appear together suggest organic pairings. Bundling these items into single offers makes purchasing more convenient and often increases the overall cart value.
- Inform promotional strategies. Co-occurrence reveals which products complement each other. Promotions like “buy one, get one” or “complete the set” can be targeted to encourage add-on purchases and reduce friction in decision-making.
- Enhance cross-sell and upsell performance. Knowing which products tend to travel together allows businesses to present timely, relevant suggestions, whether in-store, online, or through personalized marketing.
- Optimize product placement. Co-purchased items can be merchandised together, physically or digitally, to streamline the path to purchase and drive unplanned but contextually logical add-ons.
All of these strategies contribute to the same goal: increasing average basket size by meeting customer needs more holistically and intuitively. The power of basket analysis lies in recognizing that purchases don’t happen in isolation, retailers can align more closely with how customers actually shop.
Basket Analysis Analysis with Lumi
Lumi makes it simple to conduct basket analysis using natural language. Here’s how it works, step-by-step:
1. Segmenting by Basket Size
We begin by asking Lumi:
“Can you show me the number of transactions grouped by basket size specifically, transactions with 1 item, 2 items, 3 items, and 4 or more items?”
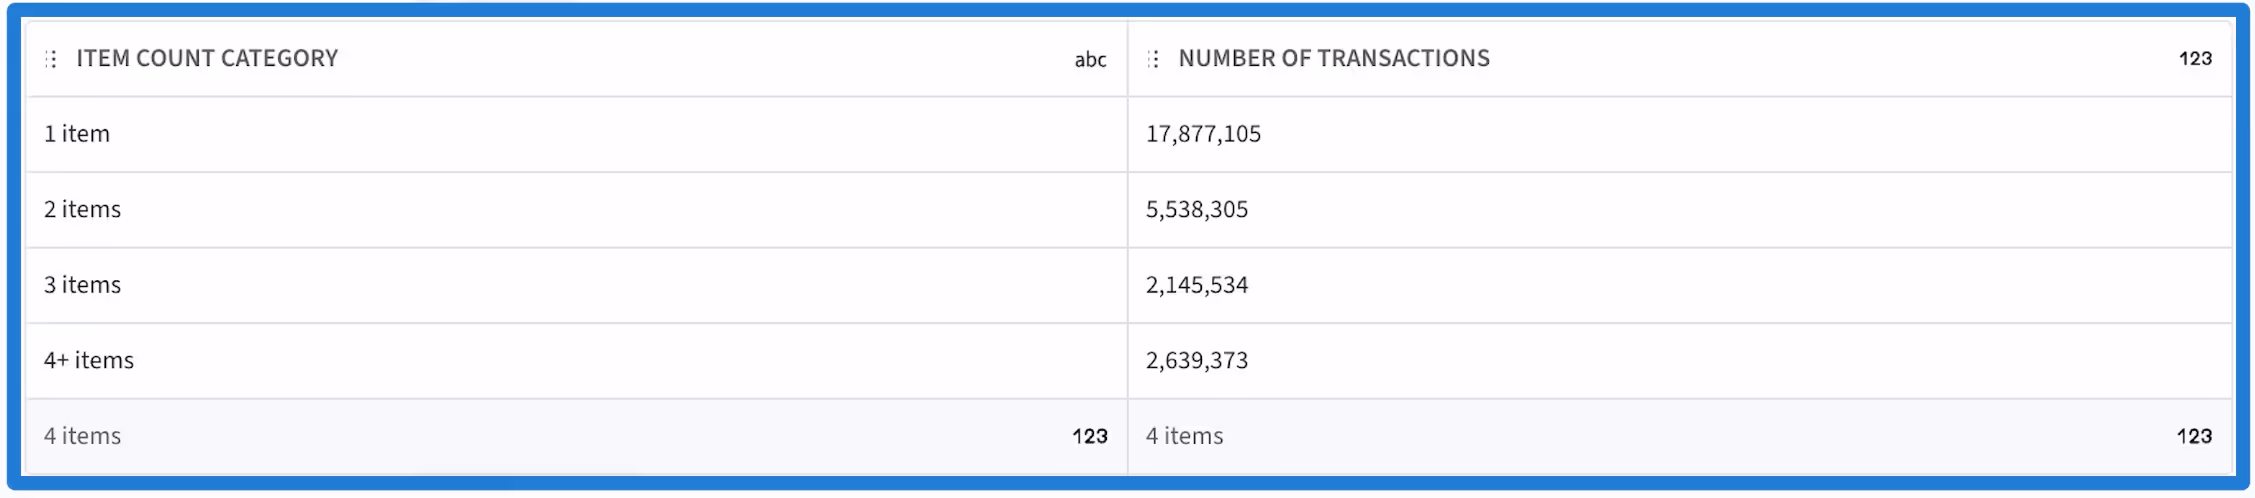
This helps identify whether most purchases are single-item or multi-item, informing strategies like bundling or minimum spend thresholds.
2. Finding Frequently Bought Item Pairs
Next, we ask Lumi:
“Can you show me the most frequently bought item pairs in transactions from 2025?”
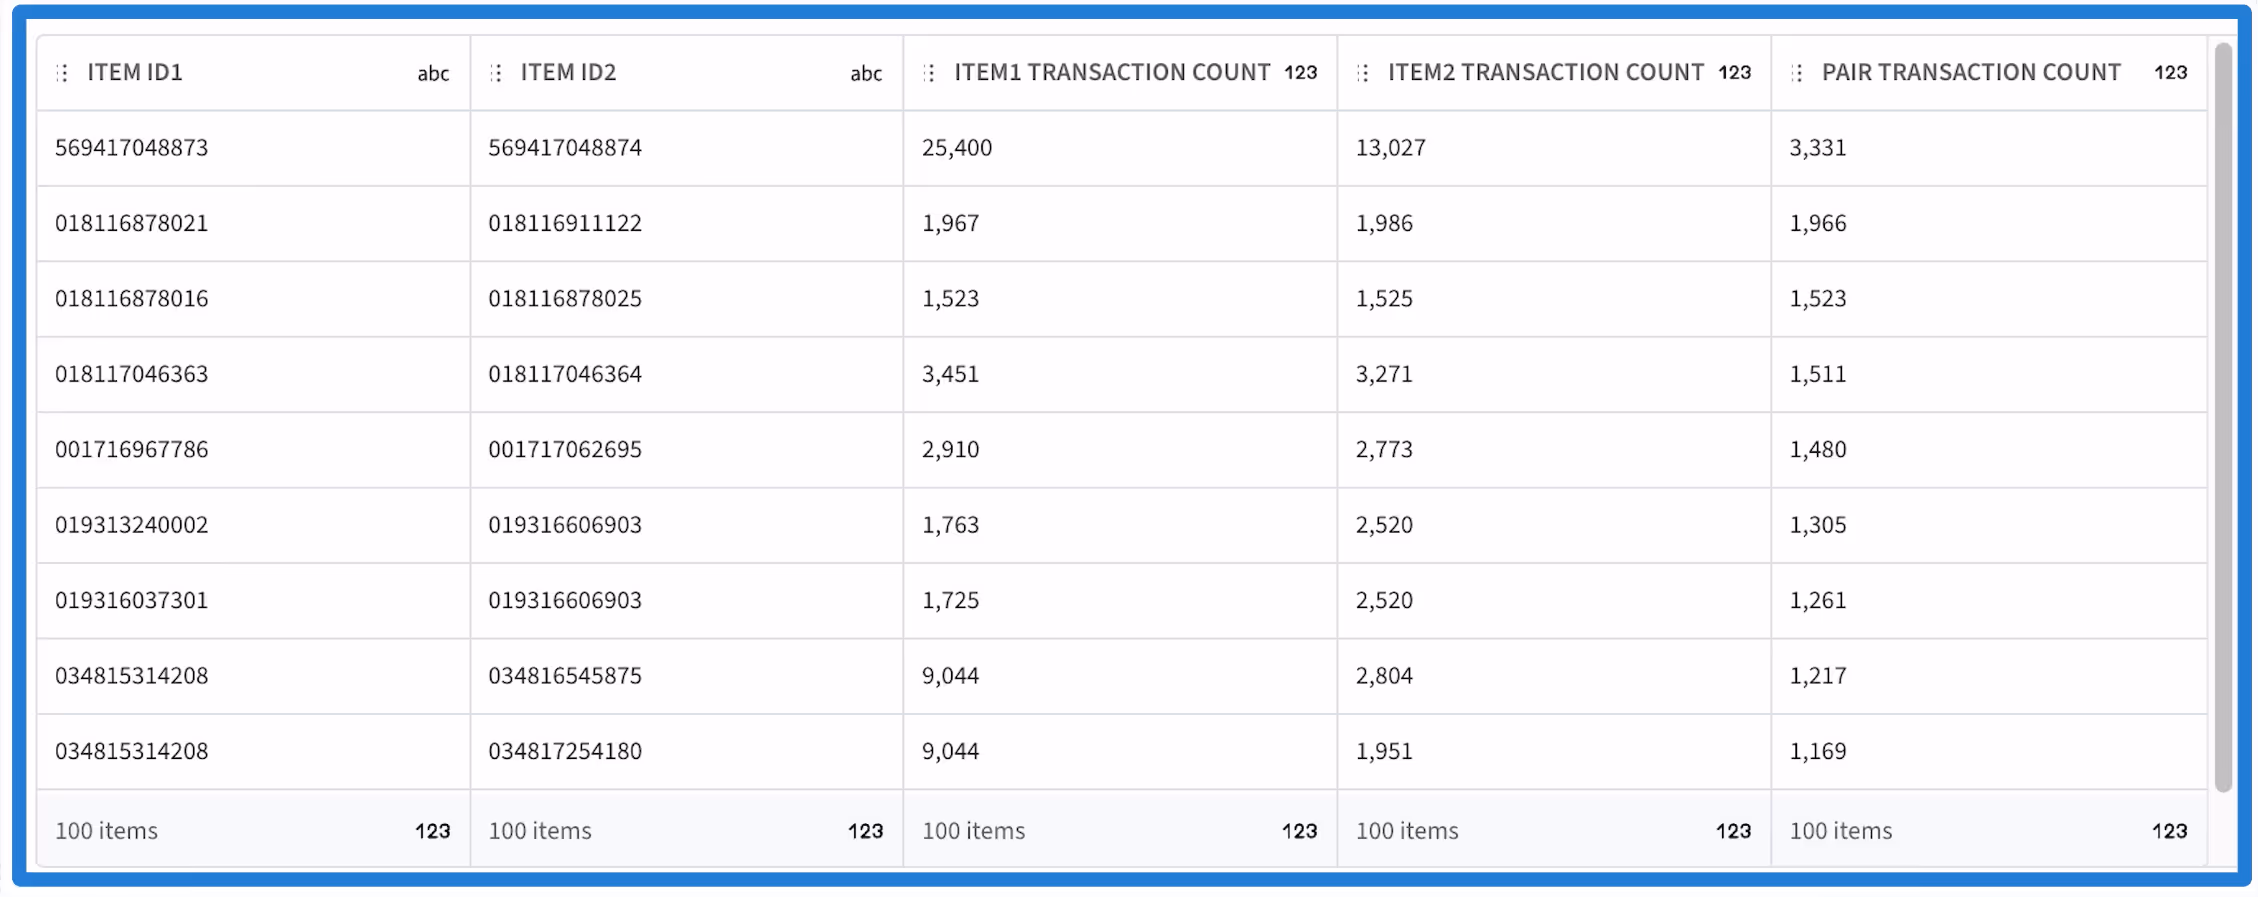
This step reveals natural product affinities and is key to planning promotions, combos, or discounts.
3. Full Basket Analysis with Confidence Scores
To deepen the analysis, we request:
“Can you show a full basket analysis, including confidence scores for each item?”

Lumi returns a full basket analysis report. In this case, if Item A → Item B has a confidence score of 0.80, it means 80% of the time customers buy A, they also buy B. Sorting by descending confidence indicates the strongest product relationships. Lumi also generates summaries pointing out top bundling opportunities by item ids.
Discover how Lumi AI can streamline your demand planning processes with advanced AI-driven insights and automation. Book your demo today.
Frequently Asked Questions
Q1: What is basket analysis?
Basket analysis is a technique used to identify patterns of items that are frequently purchased together. It helps businesses understand product associations and customer buying behavior by analyzing transaction data.
Q2: What is market basket analysis in analytics?
In analytics, market basket analysis is used to uncover product co-occurrence patterns within large datasets. It often involves metrics like support, confidence, and lift to measure the strength and relevance of associations between items.
Q3: What is the difference between clustering and market basket analysis?
Clustering groups customers or products based on similarity (e.g. behavior, demographics), whereas market basket analysis focuses on the relationships between items purchased together. One segments data; the other maps item associations.
Q4: What’s the difference between support, confidence, and lift in basket analysis?
Support: Measures how often a product pair appears together in the same transaction.
Example: If item A and item B are purchased together in 100 out of 10,000 transactions, the support is 1%.
Formula: Support(A, B) = (Number of transactions with both A and B) ÷ (Total transactions)
Confidence: Measures the probability of purchasing item B given that item A has been purchased.
Example: If A appears in 500 transactions and A and B appear together in 100, then the confidence is 100 ÷ 500 = 20%.
Formula: Confidence(A → B) = Support(A and B) ÷ Support(A)
Lift: Indicates how much more likely items A and B are to be purchased together compared to if they were bought independently.
Example: If Confidence(A → B) is 0.2 and Support(B) is 0.1, then Lift = 0.2 ÷ 0.1 = 2 (meaning A and B are twice as likely to be bought together than by chance).
Formula: Lift(A → B) = Confidence(A → B) ÷ Support(B)
Q5: How does Lumi generate the SQL for these analyses?
Lumi understands the data schema and translates natural language into SQL queries automatically, runs the query on the source system then returns the results with an explanation and assupmtions made to generate the query.

Make Better, Faster Decisions.
.png)
.png)
.avif)
.avif)
Join Our Newsletter
Subscribe for the latest on self-service analytics, AI, and data-driven transformations.


