Visualize Trends


Visualize Trends
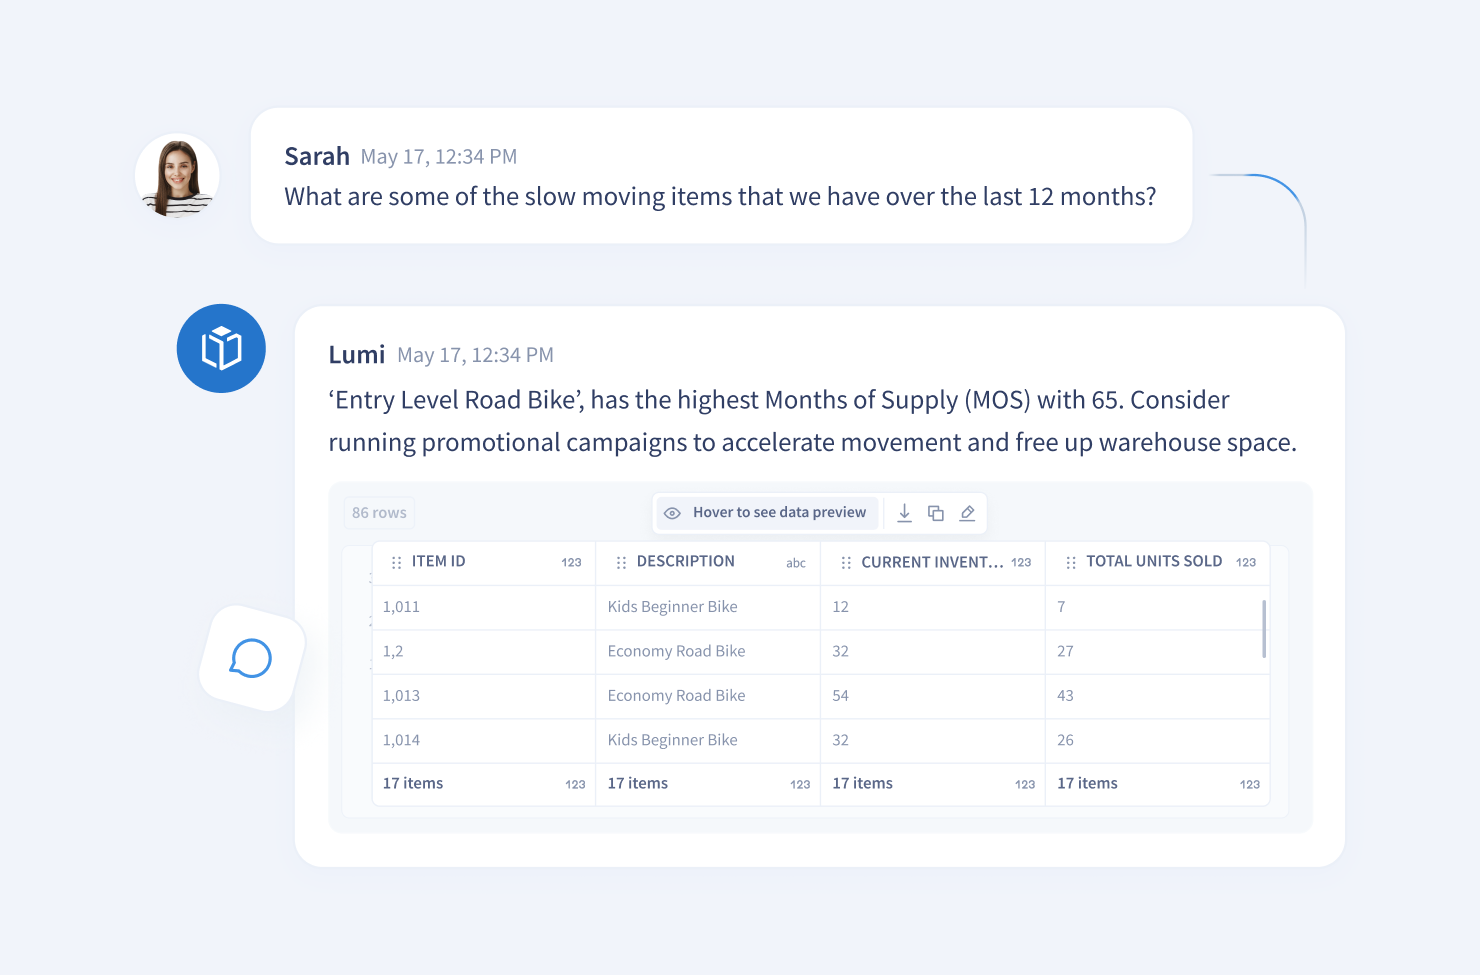
This interactive demo shows how Lumi converts natural-language questions into dynamic trend visuals. Users can adjust time ranges, compare categories, and switch metrics without building reports.
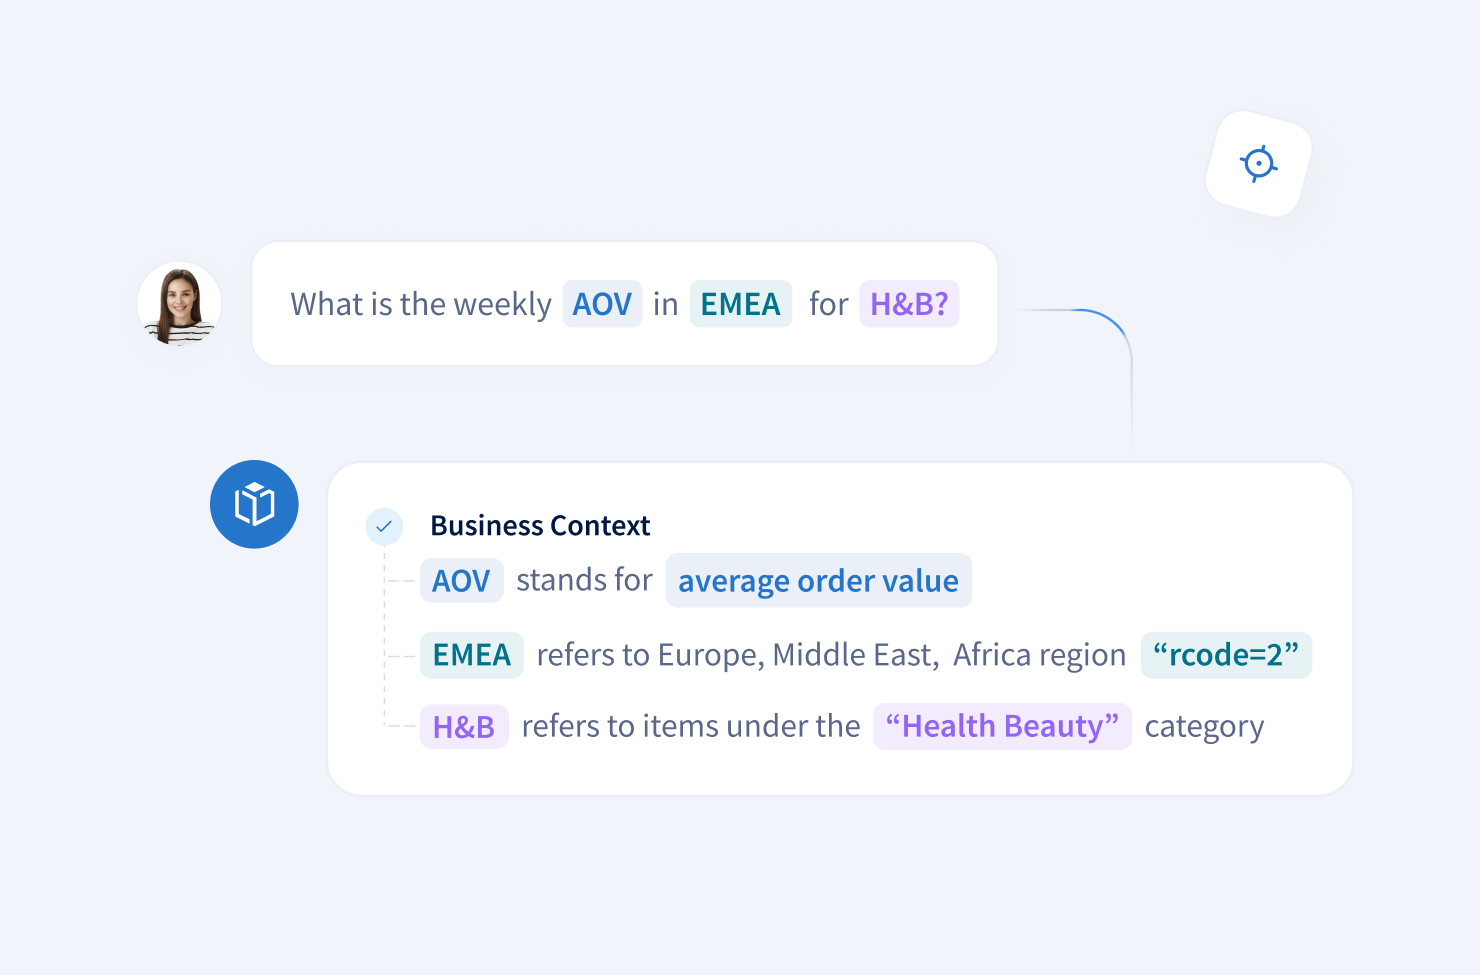
Adjust filters, pivot metrics, or explore segments inside the same visual. Lumi automatically apply the correct business context so your charts reflect how the organization actually runs. The result? Clarity without back-and-forth requests and consistent, trustworthy visuals for enhanced understanding.
Adjust filters, pivot metrics, or explore segments inside the same visual. Lumi automatically apply the correct business context so your charts reflect how the organization actually runs. The result? Clarity without back-and-forth requests and consistent, trustworthy visuals for enhanced understanding.
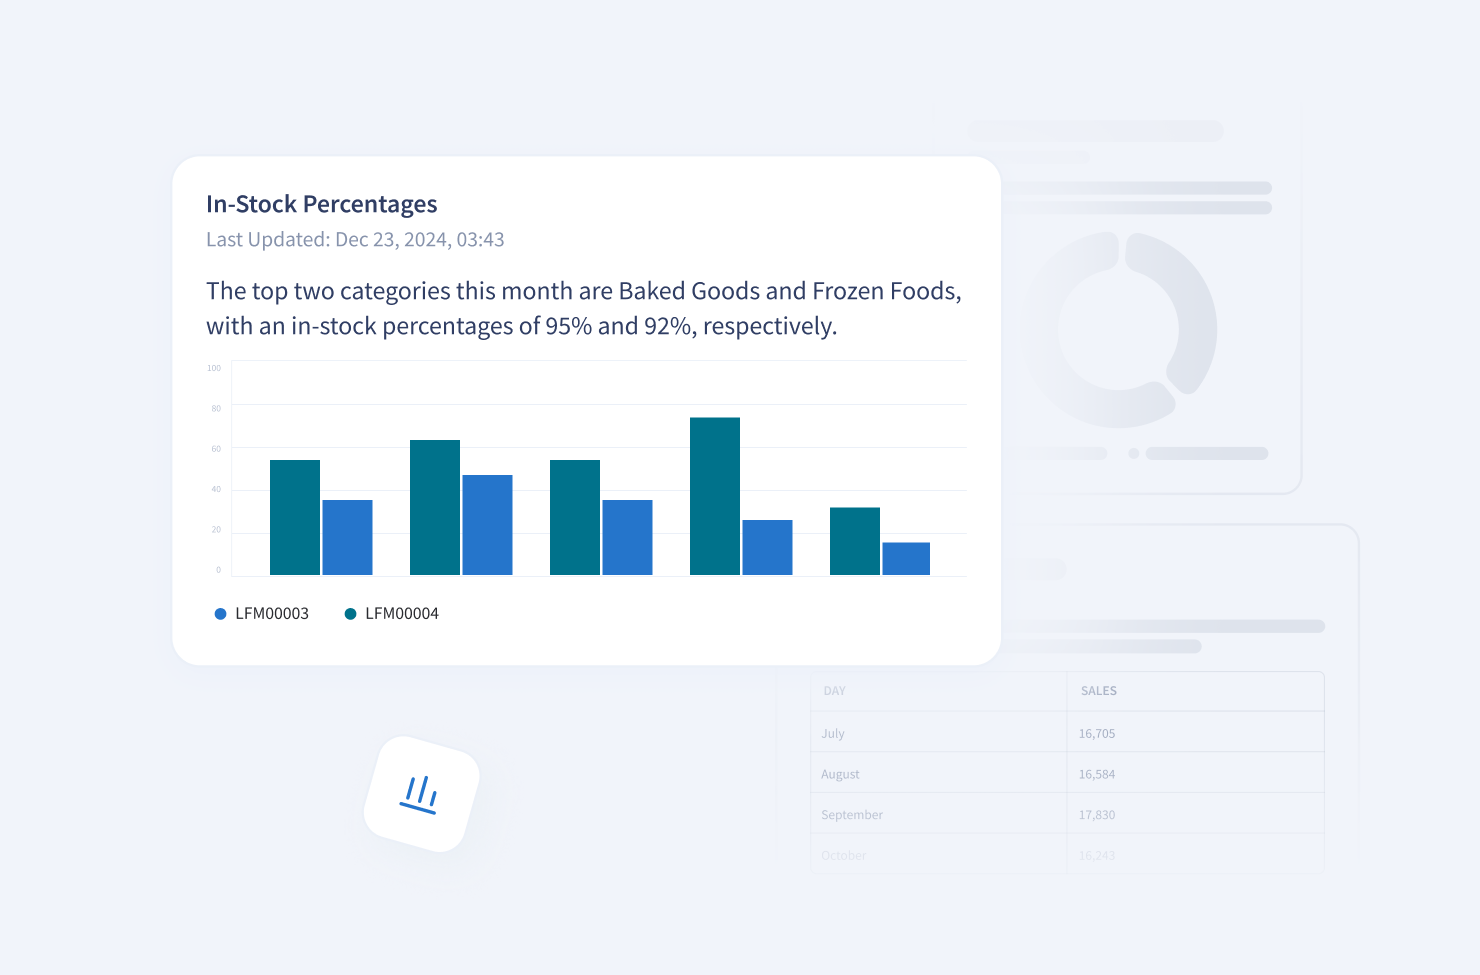
Lumi generates ready-to-share charts that can be pinned to boards, refreshed automatically, or exported for presentations. Trend visuals update at the cadence you choose, which removes manual reporting cycles and reduces dependency on ad-hoc requests.
See changes over time
Lumi translates your operational data into compelling visuals that showcase the results of any analysis. Charts that once required complex code now appear dynamically, giving teams a fast way to understand risk or opportunity hidden inside their value chain.
Enhance understanding
Adjust filters, pivot metrics, or explore segments inside the same visual. Lumi automatically apply the correct business context so your charts reflect how the organization actually runs. The result? Clarity without back-and-forth requests and consistent, trustworthy visuals for enhanced understanding.
Simplify reporting
Lumi generates ready-to-share charts that can be pinned to boards, refreshed automatically, or exported for presentations. Trend visuals update at the cadence you choose, which removes manual reporting cycles and reduces dependency on ad-hoc requests.

Redshift


Dynamics
Nav
Redshift
Dynamics
Nav


Learn More

Connect
Learn how to set up connections quickly and securely.

Configure
Follow our guidelines to set up a robust knowledge base.

Chat
Discover best practices for crafting clear, impactful prompts.


.avif)
Frequently
Asked Questions
Find answers to common questions in our FAQ. For
more inquiries, reach out to info@lumi-ai.com
Lumi is a chat-based AI data analyst that uncovers hidden ROI across ERPs and databases faster and a fraction of the cost of manual analysis.
Traditional BI tools excel at tracking predefined metrics through dashboards. They’re not designed to answer the highly specific, ad-hoc, or exploratory questions teams face daily. Lumi lets business users ask custom, plain-language questions and instantly pulls the right data, runs the analysis, and explains the logic behind the answer. Lumi works alongside tools like Tableau and Power BI by handling the long tail of exploratory and one-off questions that dashboards aren’t built to serve.
No. Text-to-SQL is only one small piece of what Lumi does. Lumi uses multiple agents, a structured knowledge base to interpret intent, apply business definitions, run the right analyses, and generate clear, decision-ready insights. SQL generation may happen behind the scenes, but the value comes from understanding context, automating analysis, and explaining results, not simply converting text into queries.
Lumi answers a wide range of simple, complex, and even vague questions. Clients use it to surface exceptions, diagnose root causes, and uncover opportunities hidden in large structured datasets. Click here to learn more.
Mid-to-large CPG and F10 retail clients have identified multi-million dollar opportunities across inventory, sales, and procurement. Click here to view our case studies.
Lumi connects to a wide range of ERPs, databases and data warehouses, including SAP, Postgres, and Snowflake. You can access the full list of connectors here.
Yes. Teams can connect spreadsheets along with their other data sources. Lumi treats them like any other input once they are available inside the environment. Lumi is flexible and can extract insights that pull from both structured and unstructured data sources.
Lumi runs inside your environment and does not move or store your data externally. All processing happens within your network and follows your existing security controls. Lumi supports role-based access control, enforces query cost and duration limits, and connects through advanced data gateway connectors designed for secure, read-only access. Lumi is also SOC 2 compliant so your data remains protected end to end. Learn more about our security page.
Onboarding is swift, typically requiring just a few hours of effort. The process involves (1) establishing a connection and (2) configuring the knowledge base. We also offer personalized, white-glove onboarding for enterprise customers.
Yes, we offer a low-risk, low-effort pilot program that allows enterprise customers to trial Lumi's capabilities. It’s designed to deliver value within ~2 weeks through a focused scope and defined use cases. Learn more here.

The New Standard for Analytics is Agentic
Make Better, Faster Decisions.

