
AI & Analytics
Self-Service Analytics Without SQL: A Buyer's Guide for Data Leaders
Your company has Power BI. Maybe Tableau. Possibly both. You have more dashboards than anyone can count, a data team that's permanently backlogged, and business users who still send Slack messages asking someone to "pull a quick number."
The problem isn't that your team hasn't tried. It's that the tools you bought were designed to display data, not answer questions.
This guide gives you a framework to evaluate every self-service analytics tool on your shortlist by architecture, not feature count. By the end, you'll know which of three structural tiers a given tool belongs to, what that means for your non-technical users, and the six criteria that actually predict whether a tool will get used or get abandoned.
The Self-Service Promise vs. The Self-Service Reality
Enterprises have been promised self-service analytics for over a decade. Most still haven't delivered it. Despite years of investment, analyst research consistently puts the share of employees who regularly use BI tools at around 30% across most organizations, a figure that has remained stubbornly stagnant even as vendors have poured resources into ease-of-use improvements.
The failure mode is consistent: organizations build dashboards, train users, and then watch adoption collapse within six months. Business users go back to filing tickets. Data teams go back to pulling reports.
The reason isn't user resistance. It's that dashboards can only answer questions someone already thought to ask. When a category manager wants to know why sell-through dropped in the Northeast last month, no pre-built dashboard surfaces that answer, because nobody built a dashboard for that specific question on that specific Tuesday.
This is what Lumi AI coined "dashboard anarchy": companies drowning in reports, most of which go unused, while the questions that drive decisions remain unanswered. More dashboards have not produced more decisions. They've produced more noise.
The self-service problem is not an access problem. It's an architecture problem, and that distinction determines which tool you should buy.
Self-service analytics is the ability for non-technical business users to query, explore, and derive insights from enterprise data without writing SQL, filing IT tickets, or depending on a data analyst, ideally through natural language, with answers they can trust and act on immediately.
Why Most "Self-Service" Tools Still Require a Data Translator
Most tools marketed as self-service have a ceiling most buyers don't discover until after they've deployed. That ceiling shows up in three predictable ways.
The first is the drag-and-drop trap. Visual analytics platforms let users build charts and slice by filters, but only within the data model someone already configured. When a user wants to ask something outside that model, they hit a wall. They go find an analyst.
The second is the SQL-behind-the-curtain problem. Many tools now offer a natural language query bar. Type a question, get a chart. What's not advertised is that most of these interfaces translate plain English into a SQL query and run it. That works well for clean, single-step questions. It fails on anything vague, multi-variable, or investigative. "Why is this number moving?" is not a query that text-to-SQL handles reliably.
The third failure mode is terminology mismatch. Enterprise data doesn't use business language. Tables have column names like ord_fulfill_pct and sku_cd_master. When an AI returns answers in those terms, business users can't interpret them without a translator, which is exactly what self-service was supposed to eliminate.
Jordan Kuhns, Director of Wholesale Technology Portfolio at GROWMARK, experienced this before deploying Lumi AI. As Kuhns put it: "It was very obvious during the pilot that Lumi could take care of a lot of the challenges. You could just ask, rather than spending time looking for the right folder or report."
The real unlock wasn't just better querying. It was that the tool could be taught the organization's own language, which transforms technically correct answers into actually usable ones.
Understanding why these failure modes exist requires understanding the architecture behind each category of tool, which is what the next section maps.
A Framework for Evaluating Self-Service Analytics Tools: Three Tiers Worth Knowing
Not all self-service analytics tools are solving the same problem. The clearest way to evaluate your options is to group them by architectural tier, what the tool is fundamentally built to do, not what the marketing says.
Tier 1: Traditional BI with NL Bolt-Ons
This tier includes Tableau, Microsoft Power BI, and Looker. These are dashboard-first platforms that have added natural language features on top of an existing visualization engine.
Power BI's Q&A feature and Tableau Pulse (which replaced the retired Ask Data feature in 2024) let users type questions and return charts. Microsoft has pushed further with Power BI Copilot, integrating large language models into the reporting workflow. These are real improvements, but the underlying model is still dashboard-first. NL capabilities work within a predefined data model, not across your full data estate on an ad-hoc basis.
Tier 1 tools are right for organizations where most analytical needs are answered by reports someone has already defined, governance is the primary concern, and the data team can maintain the underlying models. They are not right for business users who need to investigate unknown problems.
Tier 2: Search-Based and NL Query Tools
This tier includes ThoughtSpot, Sigma Computing, and Omni AI. These tools were built with more flexible querying in mind, users can explore data through search interfaces, spreadsheet-style workbooks, or NL prompts without waiting for a dashboard to be pre-built.
ThoughtSpot pioneered search-based analytics and has added GPT-powered features. Sigma offers a familiar spreadsheet interface backed by SQL, appealing to analysts and data-literate business users. Omni combines a workbook interface, a shared semantic model, and multiple query modes.
The structural ceiling here is that most of these tools remain sophisticated text-to-SQL systems. They retrieve answers well when the user knows what they're looking for. They struggle when the question is open-ended, multi-hop, or investigative. A user asking "what's driving the dip in our Q3 fill rate?" needs a system that can break that question down, not one that translates it into a single query and returns a table.
Tier 2 tools are right for data-literate users and analysts who want faster retrieval. They are not right for organizations where non-technical users need to investigate problems they haven't pre-defined.
Tier 3: Agentic AI Analysts
This tier is where Lumi AI operates. The architectural difference is not a natural language interface, it's what happens behind that interface.
An agentic analytics platform uses a multi-agent architecture to orchestrate investigative sub-tasks. When a user asks a vague, multi-variable question, the system doesn't translate it into a single query. It breaks the question down, clarifies ambiguity, runs parallel sub-analyses, and surfaces the contributing factors, the way a skilled human analyst would work through a problem.
Lumi describes this as going "beyond simple text-to-SQL," and the distinction is meaningful. When a Kroger demand planner asks about unfulfilled demand across stores, a Tier 2 tool returns a query result. A Tier 3 tool de-averages across store-item combinations, re-aggregates to surface the impactful segments, and explains what's driving the pattern. Lyle O'Banion, who handles demand planning at Kroger, noted: "Analyzing this volume of data is very time-consuming. Lumi's ability to de-average and re-aggregate down to store-item impacts makes it far more efficient."
Tier 3 tools are right for organizations where business users need to investigate problems no one has thought to dashboard yet, where data complexity is high, and where the analytical value lies in discovering unknowns, not retrieving knowns.
The tier your organization needs determines the criteria that matter most in your evaluation.
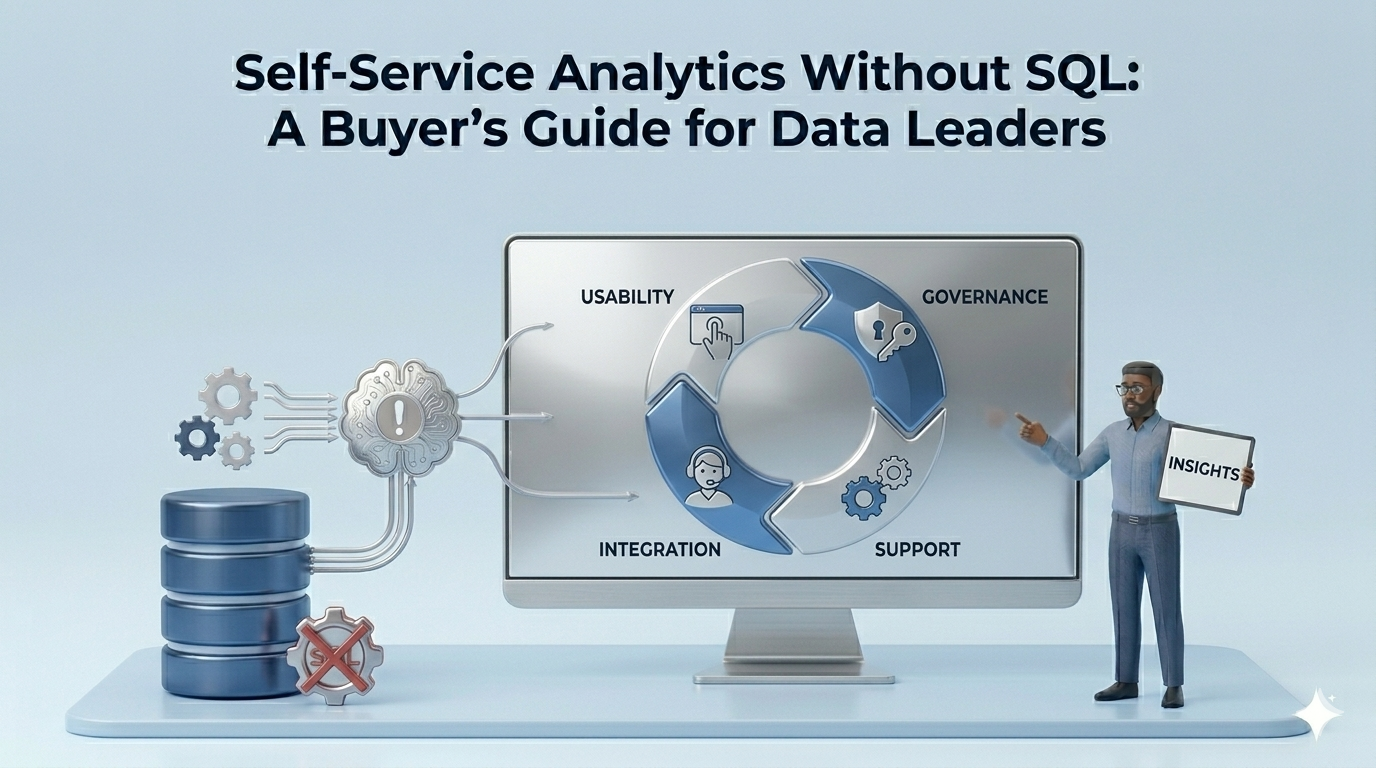
The Six Criteria That Actually Separate Good from Great
Running a meaningful evaluation means testing the right things. These six criteria map directly to the failure modes that kill non-technical user adoption.
1. Natural Language Depth: Does It Handle Vague Questions?
The real test is not whether a tool answers a clean question. It's what happens when a business user asks something open-ended: "Why did our procurement costs spike last quarter?"
A Tier 1 or Tier 2 tool will return a chart of procurement costs. A Tier 3 tool will investigate contributing factors, supplier variance, volume shifts, category mix, and explain what moved the number.
Evaluation signal: During the demo, ask the vendor to answer a genuinely investigative question using data that resembles yours. If the answer is a chart without an explanation, you're looking at a retrieval tool, not an analyst.
2. Semantic Layer: Does It Speak Your Business Language?
A tool that returns technically accurate answers in database terminology is not useful to a category manager or an FP&A analyst. The semantic layer, the ability to define custom KPIs, map business terminology, and set internal logic, is what closes that gap.
Jordan Kuhns at GROWMARK identified this as a turning point: "Lumi gave us a tangible reason to invest the time in documenting our data. Every time we add something, we should be that much better at answering the next question." The act of configuring business context into the tool compounded over time.
Evaluation signal: Ask whether you can define custom metrics, rename fields to match internal terminology, and set business rules that govern how calculations are made. If the answer requires a data engineer or a change to the underlying warehouse, the knowledge management layer is shallow.
3. Human Verification: Can You Trust What It Returns?
Non-technical users acting on incorrect AI-generated insights is an organizational risk. The question isn't whether AI can be wrong, it can, but whether the tool makes it possible for users to catch errors without needing SQL skills.
Evaluation signal: Ask the vendor whether the tool shows the underlying query, logic, or assumptions behind any answer. Ask whether there is a workflow for human review or escalation. Tools that produce results without explanation create adoption resistance in risk-conscious organizations.
4. Data Governance Architecture: Does Raw Data Leave Your Environment?
This question is frequently the IT dealbreaker in enterprise evaluations and rarely appears in listicle-style reviews.
Many cloud analytics tools process queries on the vendor's infrastructure. For organizations with sensitive operational, financial, or customer data, that architecture may not clear IT or legal review, regardless of how strong the features are.
Lumi AI's security architecture processes queries within the client's own infrastructure: raw data does not leave the customer's network. The platform completed a SOC 2 Type I audit in mid-2025, which addresses a threshold requirement for many enterprise security reviews.
Evaluation signal: Ask the vendor explicitly where query processing occurs. Ask for their SOC 2 or equivalent certification. If the answer is vague or the certification is pending, factor that into procurement timeline.
5. Time to Deploy: When Does Value Actually Start?
Enterprise analytics implementations have a history of promising transformation and delivering a six-month onboarding. For non-technical user adoption, slow starts destroy momentum before any user has experienced value.
AgFunder's coverage of Lumi's seed round noted that a major retail client was "up and running within a week." That timeline is not universal, but it sets a reasonable benchmark for what a well-designed deployment process looks like.
Evaluation signal: Ask the vendor for the median time from contract signature to the first meaningful user query, not time to full deployment. Ask what the onboarding process requires from your data team in the first 30 days.
What Real Enterprise Deployments Actually Look Like
Three examples from Lumi's client base show what Tier 3 analytics delivers when the architecture is right.
Kroger deployed Lumi to analyze unfulfilled demand across one of the largest grocery networks in North America. The value was not in the query, it was in the analytical depth. Lumi's ability to operate at store-item level granularity, de-averaging across the full dataset, surfaced patterns that aggregate dashboards obscure. Unfulfilled demand that was invisible at the category level became actionable at the SKU-store level.
Chalhoub Group, the largest luxury retailer in the Middle East, identified $60 million in additional revenue opportunities using Lumi, according to Lumi AI's published case study. The insight was not a number anyone had built a dashboard to find. Lumi identified that a specific segment of convertible customers, those who purchased online, would generate significant incremental revenue if they made even one annual purchase in-store. That hypothesis emerged from the data, not from a pre-built report.
GROWMARK, a leading agricultural cooperative, used Lumi to perform statistical analysis that previously required in-house data scientists. According to Lumi AI's published case study, the organization ran on Amazon Athena and had fragmented reporting across its member companies. Lumi's semantic layer gave the team a single place to define business context, and the conversational interface made that context accessible to non-technical users across the organization.
The pattern across all three: the value came from questions nobody had thought to ask in advance.
For the full case study library, Lumi maintains an updated repository at lumi-ai.com/blog.
Frequently Asked Questions
Can business users really get accurate insights from AI analytics tools without any technical training?
Yes, but accuracy depends on how the tool has been configured, not just how it was built. A tool with a well-configured semantic layer, where the organization's KPIs, terminology, and business logic have been defined, produces answers that are both accurate and interpretable by non-technical users. Accuracy also depends on transparency: tools that show the underlying logic behind an answer let users sanity-check outputs without needing SQL. Human verification workflows, where users can flag an answer for review, add a further layer of reliability for high-stakes decisions.
What's the difference between Tableau or Power BI and AI-powered analytics platforms like Lumi AI?
Tableau and Power BI are dashboard-first platforms. They visualize data that someone has already decided to track, and their NL features work within pre-built data models. AI-powered query tools like ThoughtSpot or Sigma go further, they allow ad-hoc NL querying across data, but most are text-to-SQL systems that retrieve answers rather than investigate them. Agentic platforms like Lumi use multi-agent architectures to break down complex, open-ended questions into investigative sub-tasks, producing analysis rather than retrieval. These are architectural differences, not feature gaps.
What should data leaders look for when evaluating self-service analytics tools for non-technical teams?
Evaluate on six criteria: (1) NL depth, can it handle vague, investigative questions, not just clean ones? (2) Semantic layer, can you define custom KPIs and business terminology so answers come back in language users understand? (3) Human verification, does the tool show its reasoning and allow review? (4) Data governance architecture, is raw data processed within your environment? (5) Time to deploy, how long until a non-technical user can run their first meaningful query?
How long does it take to get value from a Tier 3 analytics tool?
It depends on how much business context needs to be configured upfront. The semantic layer build, defining KPIs, terminology, and data relationships, is the primary time investment, and it's ongoing: the more context you add, the more precise the answers become. For organizations with relatively well-documented data, a major retail client cited being "up and running within a week." Lumi AI also offers an Enterprise Pilot Program that lets organizations test the platform on real data before committing to full deployment.
Does an AI analytics tool replace the data team?
No, and the tools that imply otherwise are overselling. What agentic analytics platforms replace is the routine reporting and ad-hoc query queue: the backlog of requests that consumes analyst time without requiring analytical judgment. Colin K., a partner at Rebar, described the actual dynamic well: "On the one end, executives and business users can get at least preliminary answers quickly. On the other end, analytics teams can get to prototypes quickly and offload some of the more mundane requests." Data teams shift from retrieval to interpretation.
The Bottom Line for Data Leaders
The self-service analytics problem is an architecture problem. A drag-and-drop dashboard and a chat interface look different in a demo but the meaningful question is the same: what happens when a business user asks something nobody anticipated?
The decision filter is straightforward. If your business users are asking questions someone already anticipated and dashboarded, Tier 1 or Tier 2 will serve you. If they need to investigate problems no one has thought to build a report for yet, you need Tier 3.
The tradeoff worth acknowledging: agentic analytics tools require more upfront configuration investment. The semantic layer build takes time and organizational commitment, it's part data project, part knowledge management. That investment compounds, as GROWMARK found, but it is an investment. Vendors that tell you otherwise are simplifying.
The six criteria in this guide are the questions to bring into every evaluation conversation. Hold vendors to specific answers, ask for demos on data that looks like yours, and test the investigative question, not just the clean one.
Ready to see how Lumi AI performs on your actual data? Book a demo and explore the Enterprise Pilot Program before committing.
The tools that get used are the ones that answer the question in front of the user, not the question someone built a dashboard for six months ago.

Data & AI Products | Founder & CEO at Lumi AI | Ex-Director at Unicorn. Ibrahim Ashqar is the Founder and CEO of Lumi AI, a company at the forefront of revolutionizing business intelligence for organizations with a specialization in the supply chain industry. With a deep-rooted passion for democratizing data access, Lumi AI seeks to transform plain language queries into actionable business insights, eliminating the barriers posed by SQL and Python skills.
Related articles
The New Standard for Analytics is Agentic
Make Better, Faster Decisions.

