Business Intelligence
How Can AI Automatically Surface Insights from Business Data?
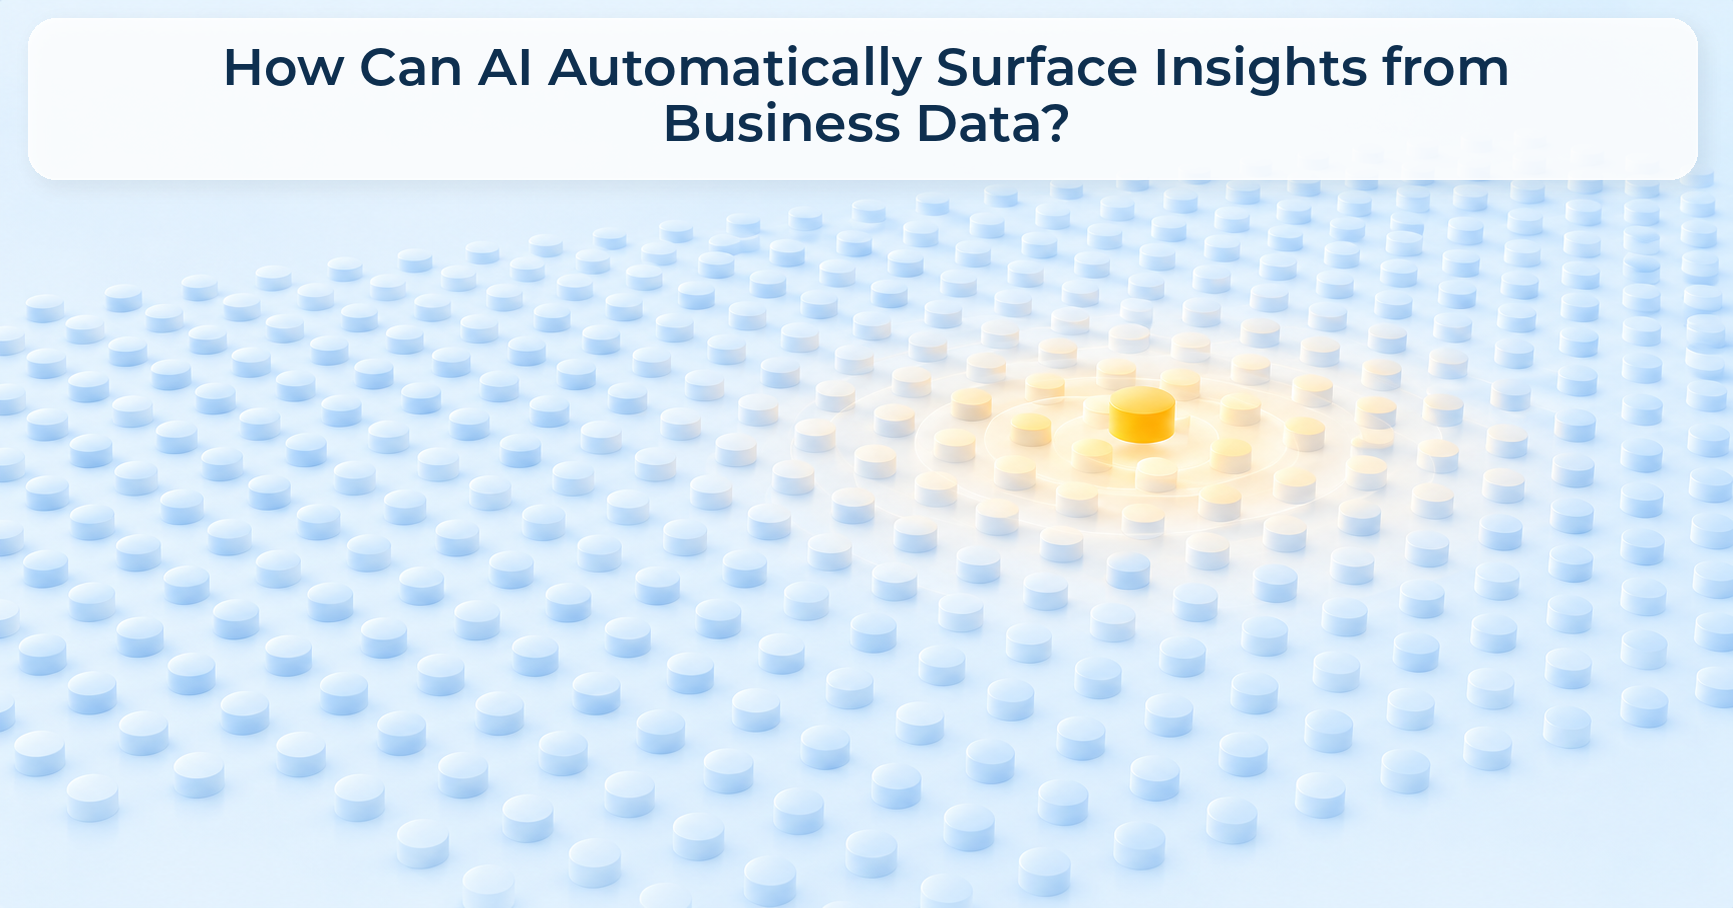
AI surfaces insights automatically by continuously watching operational data for the kind of change a human analyst would flag on sight, then explaining what shifted, why, and what to check next, without waiting for anyone to ask a question first. That's a different job than answering queries. It's a system noticing on its own.
Most "AI analytics" conversations still center on the question box: type what you want to know, get an answer back in plain language instead of a stale dashboard. That's a real improvement over waiting on a BI ticket. But it still depends entirely on someone knowing to ask. The gap that leaves open is the one this article is about: what happens to the problem nobody thought to check for.
Why "Ask a Question, Get an Answer" Isn't the Whole Job
Reactive analytics, including most conversational analytics tools, is fundamentally on-demand. A business user has a hunch, types a question, and gets a fast, accurate answer instead of a three-day wait for a report. That's genuinely valuable, and it's the foundation most self-service analytics tools are built around.
But it has a structural blind spot. The system only checks what a human already suspects to check. If a category manager doesn't know to ask why sell-through dropped in the Midwest, nobody asks, and the answer never surfaces until it shows up in a much bigger number weeks later, usually in a meeting where it's too late to act on cheaply.
Operational retail and CPG data moves fast enough that this gap matters. Inventory positions shift daily. A supplier delay cascades through fulfillment before anyone notices the pattern. A price change on one SKU quietly drags down a whole basket's margin. None of these announce themselves. They sit in the data until someone happens to look in the right place.
What "Automatic Insight Surfacing" Actually Means
Automatic surfacing means the system does the noticing, not just the answering. Concretely, that means three connected capabilities working together, rather than a single alert feature bolted on. Lumi's proactive alerts are built on this distinction, and all three parts have to be present for a flag to be worth anything:
Detecting that something changed. A pattern in the data shifts meaningfully from what it normally looks like, a sales trend bends, a fulfillment rate drops, a margin compresses in a category that's usually stable.
Explaining why, not just that. A number moving is not an insight by itself. Understanding what's behind the move, which stores, which SKUs, which supplier, which customer segment, is what turns a flag into something a person can act on. This is the same work diagnostic analytics does when a human asks "why did this happen," except the system is initiating the diagnosis rather than waiting to be asked.
Pointing at what to check or do next. A useful flag names a next step, not just a symptom, whether that's a specific SKU list to review, a location to investigate, or a forecast to revisit. That forward-looking piece overlaps with what predictive analytics is built to do: not just describing what happened, but indicating where the pattern is likely headed if nothing changes.
That combination, noticing, diagnosing, and pointing toward next steps, is closer to what the industry calls augmented analytics: using AI to do part of the analytical legwork automatically, rather than purely accelerating the answer to a question a human already framed.
It's worth being precise about what this is not. It's not a magic dashboard that predicts the future with certainty, and it's not a system that removes the need for a human to weigh in. A flagged anomaly is a starting point for investigation, the same way a good analyst brings a manager a pattern worth looking at rather than a verdict. The value is in cutting the time between "something changed" and "someone competent is looking at it," not in replacing that person's judgment.
Reactive vs. Proactive Analytics: What Each One Actually Catches
Neither replaces the other. A team that can only ask questions is always one step behind whatever it hasn't thought to check. A team that only gets flags, without a way to dig into the "why" behind them, ends up with an inbox of alerts nobody trusts enough to act on. The two need to work together: automatic surfacing narrows down where to look, and a conversational, explorable interface lets a person follow that flag back to the actual rows and reasoning behind it before making a call.
Why This Requires an Agent, Not a Lookup Tool
A single-query chatbot answers one question at a time. Surfacing an insight automatically requires something closer to how an experienced analyst actually works: notice something looks off, form a hypothesis about why, check that hypothesis against a few different cuts of the data, and only then decide it's worth raising. That's a multi-step investigation, not a single lookup, and it's the same distinction that separates a search box from a genuinely agentic, conversational analytics platform.
It also means the flag itself has to be checkable, not just asserted. An anomaly flag that can't be traced back to the specific rows and logic behind it is a claim, not an insight. That's the role a step like validating an insight plays: before a flagged pattern reaches a decision-maker, it needs a path back to its source data, the same discipline that should apply to any answer a conversational tool gives, automatic or asked-for.
Why This Depends on the Same Foundation as Self-Service Analytics
Automatic surfacing isn't a separate system bolted onto an analytics tool. It runs on the same foundation genuine self-service analytics needs: a knowledge management layer where business terms, KPIs, and what "normal" looks like for a given metric are defined and kept current, not hardcoded once and left to drift. A system that doesn't know what a normal week looks like for a specific store-category combination can't reliably tell you when this week is abnormal. That context has to be maintained the same way a knowledge base behind any accurate analytics answer has to be maintained, by someone whose job includes keeping it current as the business changes.
This is also why build-it-yourself approaches to automatic anomaly detection tend to stall. Wiring a model to a warehouse is the easy part. Teaching it what counts as a meaningful deviation, for this SKU, in this store cluster, in this season, and keeping that understanding current, is ongoing work that doesn't stop once the first version ships.
What This Looks Like in Retail and CPG Operations
The operational data retail and CPG teams work with, ERP, inventory, sales, and fulfillment, is exactly where this gap shows up most often, because the volume of individual SKU-location-day combinations is far too large for any team to check by hand on a regular cadence. Lumi AI is built specifically for that kind of operational data, not as a general-purpose BI tool retrofitted for retail.
Concretely, this is the same terrain covered by work like SKU rationalization, where the question isn't just "which SKUs are underperforming" when someone asks, but which SKUs are drifting toward that territory before a quarterly review would catch it. Kroger's work with Lumi to de-average and re-aggregate data down to the store-item level and Chalhoub Group's work to identify a $60 million revenue opportunity both illustrate the same underlying pattern: value that was sitting in the data, not visible until someone, or something, went looking at the right granularity. These are Lumi-reported results, not independently audited figures, and they're worth citing as directional evidence of what this kind of analysis can surface, not as a guaranteed outcome for every deployment.
How to Evaluate Whether a Platform Actually Does This
A vendor claiming "automatic insights" deserves a few specific questions before you take the claim at face value:
- Does a flagged insight come with a traceable explanation, or just a number and an arrow?
- Can you follow a flag back to the exact rows and logic behind it, the same way you could an answer to a question you asked directly?
- Does the system understand what "normal" looks like for your specific business, or is it applying a generic threshold across every metric?
- What happens when your business changes, a new product line, a reorganized territory, a shifted fiscal calendar? Does the system's sense of "normal" update, or does it keep flagging noise?
- Is the flag actionable, pointing at a next step, or is it a number sitting in an inbox nobody has time to investigate?
Frequently Asked Questions
What's the difference between AI that answers questions and AI that surfaces insights automatically?
Answering questions requires a person to know what to ask first. Automatic surfacing means the system notices a meaningful shift in the data on its own and flags it, before anyone submits a query.
Does automatic insight surfacing replace the need for a data team or analyst?
No. It narrows down where to look and explains what changed, but a person still needs to weigh in on what the flag means for the business and what to do about it.
Is this the same as predictive analytics?
They overlap but aren't identical. Predictive analytics focuses on where a trend is likely headed. Automatic insight surfacing is broader: noticing a current anomaly, explaining why it happened, and pointing toward what's worth checking, which often includes a predictive component but isn't limited to it.
Can a team build automatic anomaly detection in-house instead of buying a platform?
Technically, yes, but teaching a system what counts as a meaningful deviation for a specific business, and keeping that understanding current as the business changes, is ongoing work, not a one-time build.
What kind of data does this work best on?
High-volume, fast-moving operational data, like inventory, sales, and fulfillment records, where the number of individual patterns to check by hand far exceeds what a team could realistically monitor manually.
How do I know if a flagged insight is trustworthy?
Check whether it can be traced back to the specific source data and logic behind it. A flag without a verifiable path back to its source is a claim, not a validated insight.
See What This Looks Like on Your Own Data
The gap between an analytics tool that answers questions and one that also tells you what you didn't know to ask is exactly where a lot of preventable revenue and margin erosion hides. If you want to see how automatic surfacing and conversational, on-demand analysis work together on your own operational data, schedule a demo or review Lumi's pricing to find the right starting point for your team.

Data & AI Products | Founder & CEO at Lumi AI | Ex-Director at Unicorn. Ibrahim Ashqar is the Founder and CEO of Lumi AI, a company at the forefront of revolutionizing business intelligence for organizations with a specialization in the supply chain industry. With a deep-rooted passion for democratizing data access, Lumi AI seeks to transform plain language queries into actionable business insights, eliminating the barriers posed by SQL and Python skills.
Related articles
The New Standard for Analytics is Agentic
Make Better, Faster Decisions.