
Data Analytics
Diagnostic Analytics
.avif)
Organizations frequently encounter unexpected challenges. Revenue dips, margin decline, or product return spikes. Dashboards highlight these changes but stop at the surface. Diagnostic analytics identifies root causes, providing clarity. It's knowing “what changed” and understanding “why it changed.”
Diagnostic analytics goes beyond surface-level reporting by tracing problems back to their underlying drivers. Instead of only showing that a performance issue exists, it reveals the factors behind it, whether inefficiencies in a process, shifts in customer behaviour, or breakdowns across the supply chain. This clarity allows businesses to understand why outcomes changed and gives them the foundation to take targeted, corrective action.
There are tangible advantages to advancing beyond basic reporting, as businesses that adopt diagnostic analytics consistently see clearer insights and stronger outcomes.
A recent survey highlights that organizations with mature analytics capabilities are 6 times more likely to retain customers and 23 times more likely to acquire new ones. Another study found that companies adopting diagnostic and advanced analytics are 2.5 times more likely to boost operational efficiency, particularly when root cause analysis is embedded into decision making processes.
In this blog, we will explore diagnostic analytics in depth, breaking down what it is, how it works, the benefits it brings, the techniques behind it, and the challenges businesses often face. We will also look ahead at emerging trends and highlight how Lumi supports organizations in turning diagnostic insights into practical, growth-driving actions.
Key Takeaways
- Diagnostic analytics digs into data to answer why events happen, turning observations into actionable insights.
- Key benefits include better decision-making, risk reduction, process improvements, clearer visibility, and enhanced customer experiences.
- The workflow involves problem definition, data collection, cleaning and preparation, exploration, hypothesis formulation, applying diagnostic techniques, validation, and translating insights into action while continuously monitoring outcomes.
- Common challenges include confusing correlation with causation, data overload, quality issues, missing context, and skill gaps between business and data expertise.
- Techniques include root cause analysis, hypothesis testing, correlation, regression, and anomaly detection.
- Lumi AI simplifies diagnostic analytics with plain-language queries, automated anomaly detection, and seamless integration into predictive and prescriptive analytics.
What is Diagnostic Analytics?

Diagnostic analytics is the process of examining historical data to understand the causes of past outcomes and events. Unlike descriptive analytics, which only shows what happened, diagnostic analytics explains why it happened by uncovering relationships, trends, and root causes. It relies on techniques such as drill-downs, correlation analysis, regression, and root cause analysis to identify the drivers behind performance changes.
In practice, the questions it helps answer cut across industries. For instance, in supply chain and 3PL, it might be “Why did shipping costs spike last quarter?” In retail and CPG, it could be “Why did sales dip despite steady foot traffic?” For enterprise operations, it could be “Why are project costs overrunning despite budgets being increased?”
Having actionable insight is essential before moving into prediction or prescription. Without clarity on the drivers behind past outcomes, predictive analytics risks being built on shaky assumptions, and prescriptive analytics may recommend actions that miss the real issue. Diagnostic analytics provides the bridge, ensuring that businesses address the right problems and build a solid foundation for forecasting and optimization.
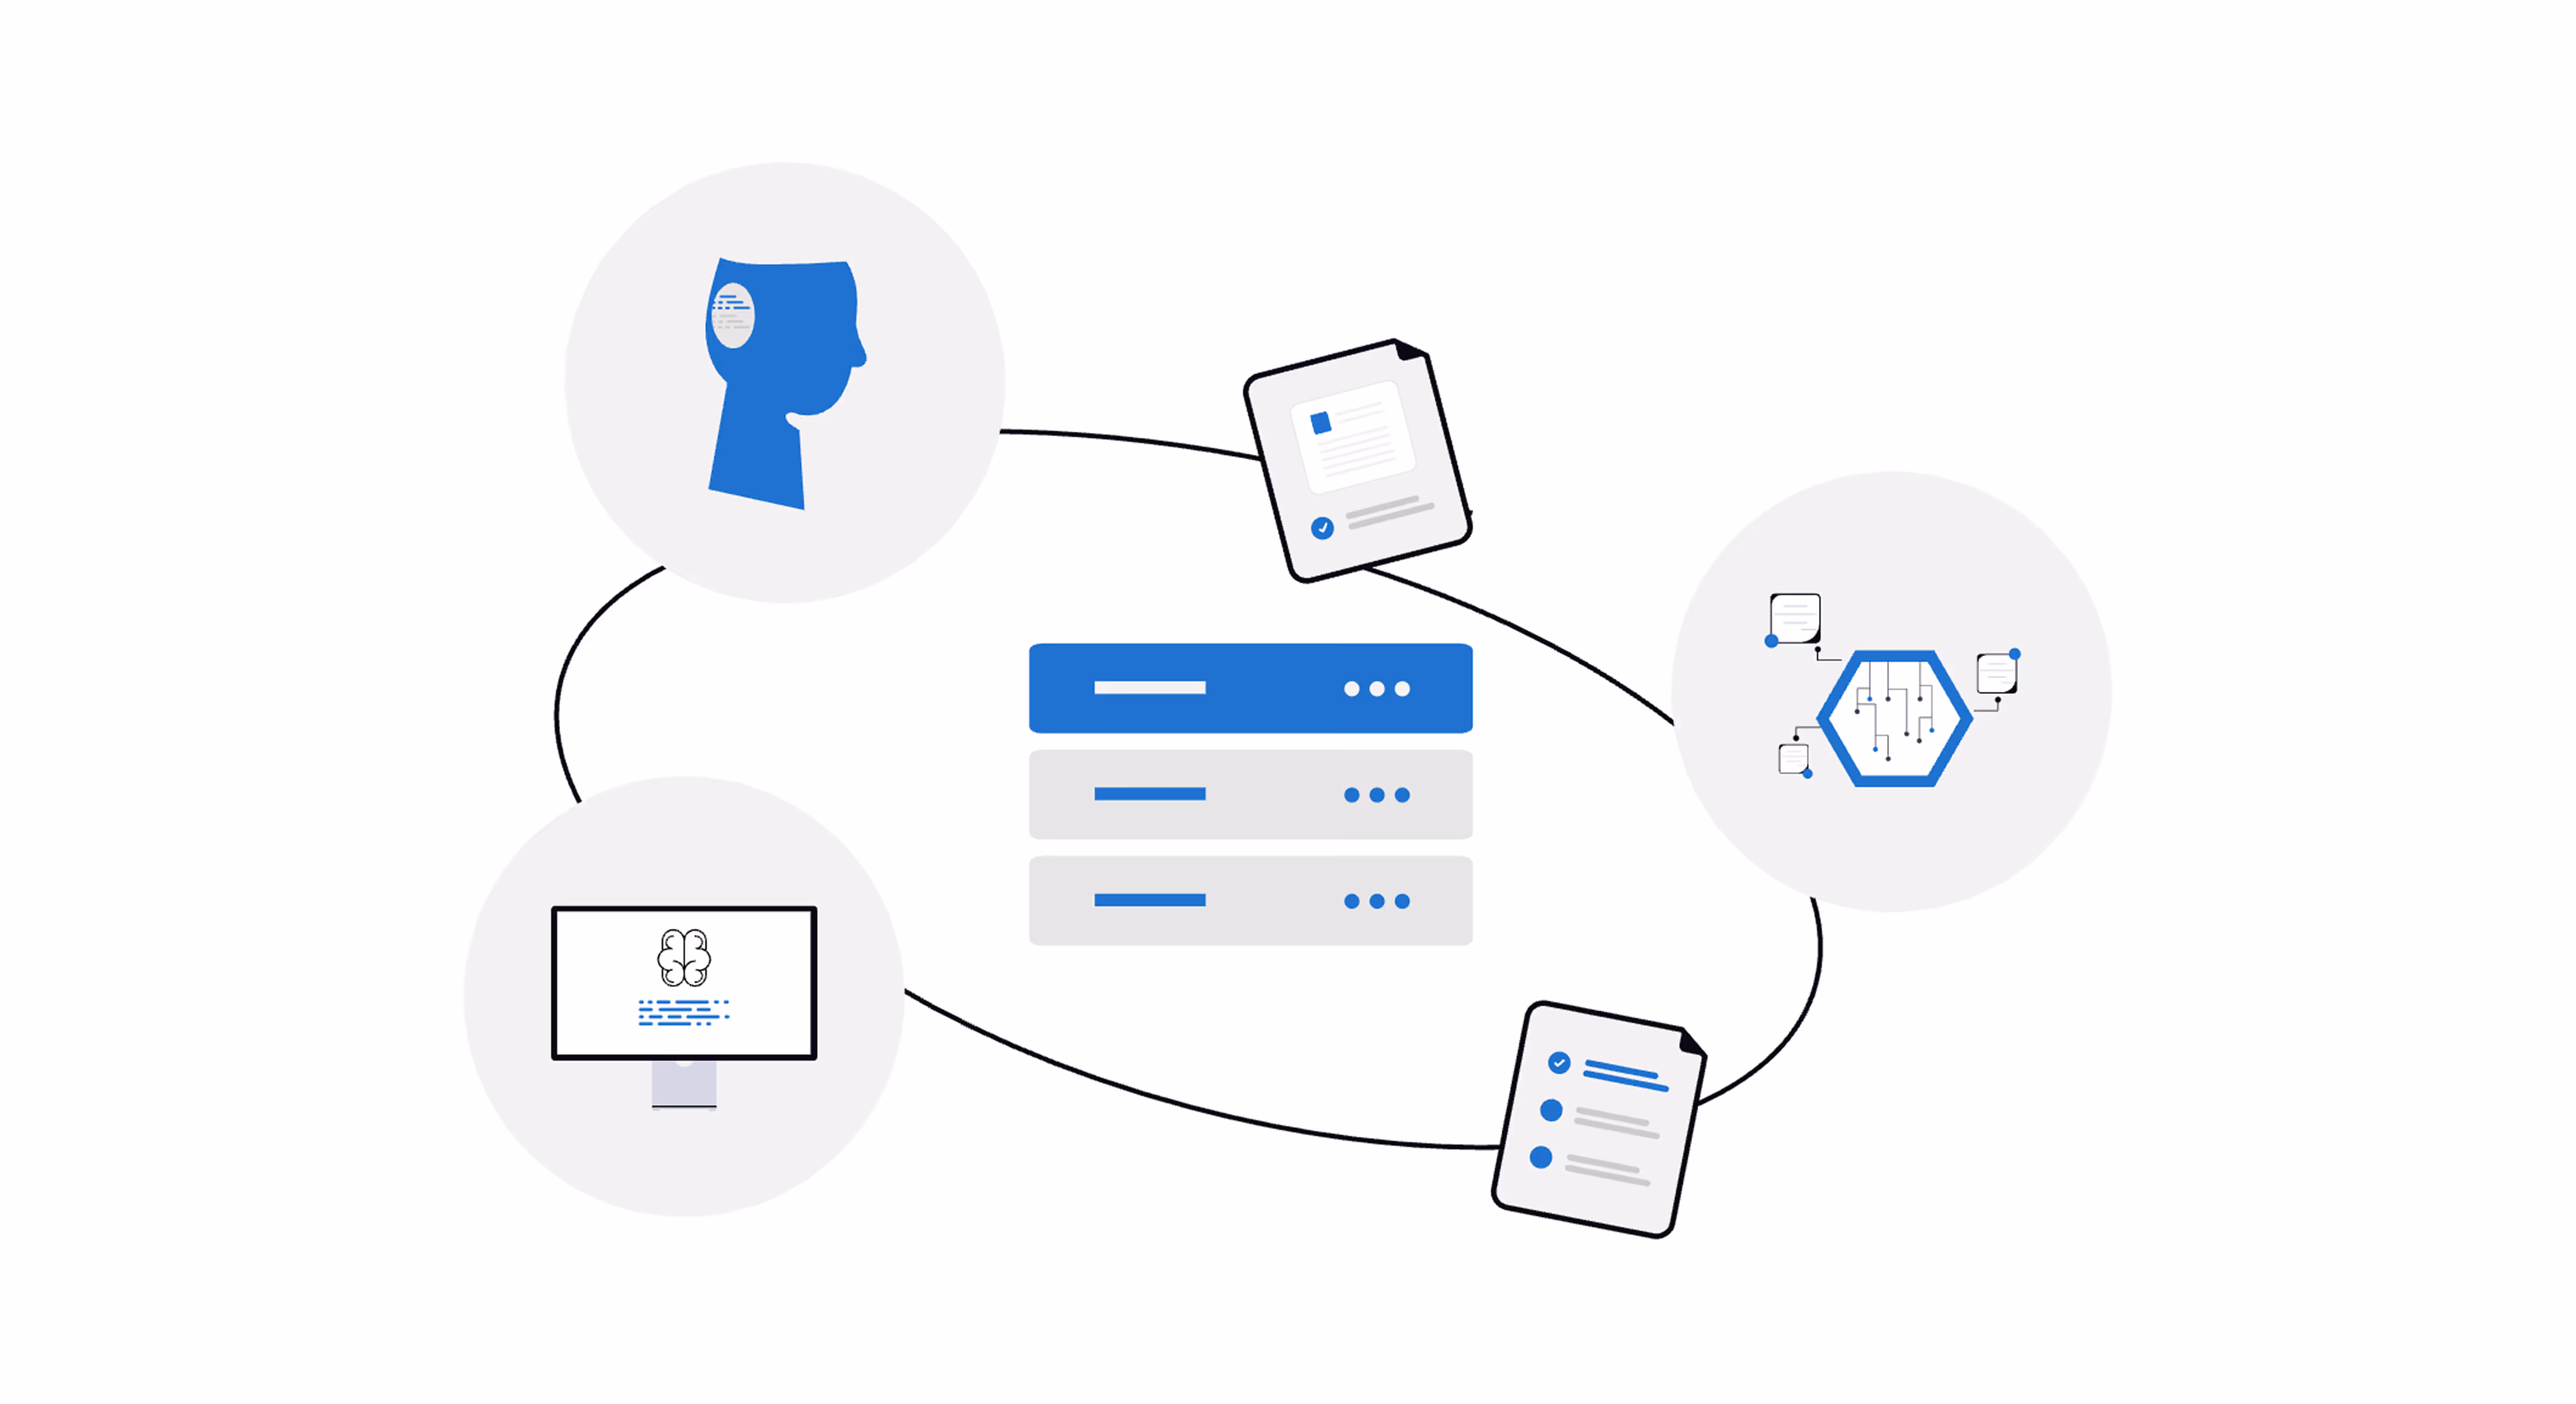
How Diagnostic Analytics Bridges Data and Decisions
The analytics stack moves in a clear progression, each layer answering a different type of question and providing increasing levels of insight.
- Descriptive analytics provides a clear view of the “what” by summarizing past events and outcomes. It answers surface-level questions such as “How many orders were delayed last quarter, and which regions were most affected?”
- Diagnostic analytics then takes on the “why.” It is the critical bridge between understanding what happened and knowing what to do next. By digging into causes and relationships, it transforms raw findings into insights. Questions sound like “Why were so many orders delayed? Was it due to supplier shortages, unexpected spikes in demand, transportation bottlenecks, or warehouse inefficiencies?”
- Predictive analytics builds on that foundation by looking ahead to “what’s likely to happen next.” With patterns and root causes already uncovered, forecasts become more accurate and relevant. This stage addresses queries such as “If these same patterns continue, how many delays should be expected in the upcoming quarter, and where are they most likely to occur?”
- Prescriptive analytics completes the progression by answering “what should be done.” With both hindsight and foresight in place, this stage points to actionable strategies. It responds to questions like “What adjustments to sourcing, routing, or inventory levels would reduce the risk of future delays and improve delivery reliability?”
Without diagnostic analytics holding the middle ground, predictions risk being shallow and prescriptions miss their mark. It is the link that ensures analytics moves from simple reporting to meaningful, informed action.
Benefits of Diagnostic Analytics
With its role in the analytics stack established, the next step is to understand what businesses actually gain from diagnostic analytics in practice. Beyond theory, its value shows up in measurable outcomes. In manufacturing, for instance, organizations that adopt diagnostic analytics achieve a 10-20% reduction in production costs, improvements of the same range in efficiency, and a 5-15% uplift in product quality. Other benefits include:
Better decision-making and risk management
Diagnostic analytics sharpens decision making and risk management by turning symptom-level reports (what happened) into insights, so leaders can quantify which factors actually drive outcomes, prioritize fixes by expected impact, and run quick what-if scenarios to compare options before committing resources. Organizations that adopt insight-driven practices report faster, more reliable decisions and stronger operational resilience, according to Deloitte. Industry analyses also show that embedding analytics into risk management helps detect and mitigate threats before they cause costly interruptions.
Clearer visibility
Clearer visibility is one of the most immediate benefits of diagnostic analytics because it reveals the operational dynamics that drive performance. Rather than relying on surface reports, teams can drill into where processes break down, pinpoint inefficiencies, and see how different factors interact. That clarity strengthens accountability, helps identify the root causes of bottlenecks, and prevents problems from escalating.
Process improvements
These become far more achievable with diagnostic analytics because it doesn’t just flag where performance is lagging, it shows why. By drilling into workflows, error rates, and throughput data, businesses can pinpoint the exact steps causing delays or inefficiencies and redesign them for better outcomes. This kind of targeted improvement eliminates guesswork and ensures resources are directed where they’ll have the greatest impact.
Improved customer experiences
Diagnostic analytics directly improves customer experiences by uncovering the reasons behind churn, complaints, or low satisfaction scores. Instead of stopping at “what percentage of customers left,” it pinpoints whether delays, product quality issues, poor service responsiveness, or pricing inconsistencies are driving dissatisfaction.
Types and Techniques of Diagnostic Analytics

Hypothesis testing
Hypothesis testing helps businesses verify whether a suspected factor is truly driving an outcome or if the change is just random. For example, if weekend sales drop after a checkout page redesign, the business can test the null hypothesis (the redesign had no effect) against the alternative (it reduced conversions). By comparing sales data before and after the change, hypothesis testing confirms whether the redesign is the real cause or if other factors like seasonality or competitor promos are at play.
Root cause analysis
Root cause analysis focuses on uncovering the underlying reason a problem exists rather than stopping at surface symptoms. Frameworks like the 5 Whys and fishbone (Ishikawa) diagrams guide teams to keep asking “why” until the core problem becomes clear. If late deliveries keep happening, is it really because of traffic delays, or could it be inventory shortages, misaligned demand forecasts, or supplier hiccups? Asking these kinds of questions helps businesses get to the real cause so they can fix it once and for all instead of repeatedly patching the same issue.
Anomaly detection
Anomaly detection looks for unusual patterns in data that stand out from normal activity, helping teams quickly spot the areas most disrupted, like sudden errors in processing or unexpected shifts in inventory levels. Instead of dividing attention across every metric, it directs focus to where problems are most visible and urgent. By bringing these outliers to light, businesses can act on the issues that promise the greatest impact, whether it’s a surge in order mistakes, unexpected system slowdowns, or sudden changes in customer behaviour.
Correlation analysis
Sometimes problems don’t have a single cause; they’re the result of multiple factors interacting. Correlation analysis helps reveal these connections by measuring how variables move together. Consider an example of a negative sales trend whenever delivery times lengthen. Correlation analysis can confirm whether these trends are linked or just coincidental. With this insight, businesses can prioritize which factors truly influence outcomes and focus their improvement efforts where they matter most.
Note: It’s important to remember, though, that correlation doesn’t equal causation. For instance, an increase in IT helpdesk tickets might coincide with a drop in employee productivity, but without considering context, such as a new software rollout or a network outage, assuming one causes the other could lead to misguided decisions, highlighting the need for validation before acting on correlations.
Diagnostic regression analysis
Diagnostic regression analysis examines how one or more independent variables influence a dependent outcome, helping businesses understand the strength and nature of relationships. For example, an enterprise operations team might use regression to see how factors like staffing levels, system uptime, and process changes impact project completion times. By quantifying these effects, teams can prioritize intervention and identify which variables truly drive performance rather than relying on assumptions.
The Diagnostic Analytics Workflow

Problem definition
This is the first step in diagnostic analytics. Businesses need to clearly identify the operational or performance issue, determine its scope, and establish what success looks like. For example, a supply chain team may seek to understand why shipment delays have increased over the past quarter or why inventory turnover has slowed. A precise problem definition ensures that subsequent analysis is focused, relevant, and actionable.
Data collection
The first step in diagnostic analytics is data collection. Businesses need to gather all relevant information from multiple sources, including internal systems like ERP, CRM, and operational logs, as well as external inputs such as market trends, competitor activity, or customer feedback. For example, an enterprise operations team might collect production schedules, inventory levels, shipment times, and customer service records to build a comprehensive dataset. The goal is to capture a complete picture of operations so that subsequent analysis is meaningful and actionable.
Data cleaning and preparation
Once the data is gathered, data cleaning and preparation ensures accuracy and consistency. This involves removing errors, duplicates, and inconsistencies while structuring the data for analysis. Without this step, misleading patterns could emerge. Data preparation also includes formatting, normalization, and sometimes enrichment by combining multiple datasets to provide deeper context. A well-prepared dataset lays the foundation for reliable diagnostic insights.
Data exploration and hypothesis formulation
With clean data in place, businesses begin data exploration and hypothesis formulation. Descriptive analytics first flags downward trends in lagging metrics, such as consistent drops in on-time shipments or lower sales conversion rates. Initial analyses and visualizations then detect patterns, trends, or anomalies. Dashboards, heatmaps, and scatter plots highlight areas of concern, including recurring bottlenecks, seasonal demand spikes, or sudden performance drops. Based on these observations, hypotheses are generated to explain potential causes. For example, frequent shipment delays might be linked to specific suppliers, staffing patterns, or equipment maintenance schedules.
Applying diagnostic techniques
The next step is applying diagnostic techniques to test these hypotheses and uncover root causes. Techniques such as root cause analysis, correlation analysis, regression, and anomaly detection help determine which factors truly drive observed outcomes. By converting assumptions into evidence-based insights, businesses can distinguish between coincidental trends and actual drivers of performance.
Validation and interpretation
Validation and interpretation follow, ensuring that findings are statistically sound and consistent across datasets. This may involve cross-checking results or using additional data sources to confirm the relationships discovered.
Actionable insights and decision-making
Finally, the insights generated are translated into actionable decisions and continuous improvement. Organizations use the findings to implement interventions such as workflow redesign, process automation, or resource reallocation.
Monitoring and continuous improvement
After changes are applied, outcomes are monitored to confirm effectiveness and identify further improvement opportunities. This feedback loop ensures that diagnostic analytics is not a one-time exercise but an ongoing approach to understanding business operations, preventing problems, and optimizing performance over time.
Barriers to Effective Diagnostic Analytics

Risk of confusing correlation with causation
One of the biggest challenges in diagnostic analytics is the risk of mistaking correlation for causation. Data may show that two variables move together, but that doesn’t necessarily mean one causes the other. For example, a 3PL provider might notice that delayed shipments often coincide with high warehouse overtime hours. It could be tempting to conclude that overtime is causing delays, when in reality other factors like inefficient packing processes, inventory mismanagement, or delayed supplier shipments might be the true problems. Misinterpreting correlations in this way can lead to misguided operational changes and wasted resources.
To address this challenge, businesses must adopt robust validation and testing methods. Hypothesis testing, controlled experiments, and regression analysis can help confirm whether relationships are causal or merely coincidental. Combining multiple techniques, like anomaly detection or root cause analysis, adds context and improves accuracy.
Data quality issues
Poor data quality is a significant challenge in diagnostic analytics. For instance, in the retail or CPG sector, inaccurate or incomplete sales records, misreported inventory levels, or inconsistent point-of-sale data can distort insights. If a retail chain’s inventory data is outdated or contains errors, diagnostic analysis may wrongly identify stockouts as the cause of declining sales in certain stores, leading to misguided restocking or promotional decisions. Data quality issues undermine the reliability of analysis and can result in costly operational mistakes.
To tackle this challenge, businesses need to implement rigorous data governance and validation practices. This includes regular audits, automated data cleaning, standardized data entry processes, and integration of multiple data sources to cross-verify information.
Overload of data without focus
Another common challenge in diagnostic analytics is the sheer volume of data available, which can overwhelm teams and obscure meaningful insights. For a 3PL provider, this might include data from shipment tracking, warehouse inventory, transportation logs, customer service interactions, and supplier performance, all flowing in at high velocity. Without a clear focus, teams may spend excessive time sifting through irrelevant or low-priority information, delaying decision-making and increasing the risk of overlooking critical issues.
To overcome this challenge, organizations should prioritize relevant KPIs and high-impact datasets before diving into analysis. Implementing structured dashboards, automated data aggregation, and filtering processes can help highlight what truly matters, such as late deliveries, inventory bottlenecks, or recurring carrier issues. Lumi strengthens this process by highlighting priority insights automatically, so teams can quickly focus on the metrics that matter most to performance.
Missing context (External factors not captured in datasets)
Diagnostic analytics can struggle when critical external factors are not captured in the available datasets. In enterprise operations, a sudden drop in project completion rates may appear linked to internal staffing levels, but unrecorded external factors such as vendor delays, regulatory changes, or supply chain disruptions could be the real drivers. Without this context, analyses can misattribute causes, leading teams to focus on areas that may not actually be impacting performance.
To address missing context, organizations should incorporate external data sources and domain knowledge into their analyses. Integrating supplier performance data, industry reports, market trends, or regulatory updates alongside internal operational metrics provides a fuller picture of what influences outcomes. By combining internal and external insights, enterprise operations teams can generate more accurate diagnostic findings and make decisions that reflect the broader factors affecting performance.
Skills gap between business and data expertise
One of the biggest obstacles in diagnostic analytics is the disconnect between operational knowledge and data skills. In supply chain operations, teams may understand logistics, inventory, and transportation processes but lack the technical skills to interpret complex datasets, build models, or apply statistical techniques. This disconnect can lead to misinterpreted findings, underutilized data, or incorrect assumptions about what drives performance, limiting the impact of analytics efforts.
To overcome this challenge, organizations should invest in cross-functional training and collaborative analytics teams. Pairing supply chain professionals with data analysts or providing staff with training in analytics tools ensures that insights are correctly interpreted and applied. Lumi’s self-serve capabilities also enable supply chain teams to explore data and validate hypotheses without relying solely on technical experts.
Industry Applications
Supply chain/3PL
In logistics, diagnostic analytics improves operational efficiency and decision-making. Analyzing shipment data, inventory levels, routing, and supplier performance can reveal whether delays are caused by warehouse bottlenecks, transportation issues, or supplier disruptions, enabling targeted actions like route optimization, resource reallocation, or supplier adjustments.
Warehouse bottlenecks can also be identified by examining storage utilization, order processing times, and workforce productivity. This helps teams address process inefficiencies, equipment limits, or staffing gaps, minimizing delays and increasing throughput.
This was demonstrated by General Motors, which leveraged AI-powered diagnostic tools to manage and prevent supply chain disruptions from natural disasters and material shortages. In 2025 alone, this system averted around 75 production halts, demonstrating the effectiveness of data-driven decision-making in maintaining operational continuity.
Retail/CPG
In retail and CPG, diagnostic analytics identifies the causes of operational issues. When product returns rise, it helps analyze batch quality, supplier performance, packaging defects, and regional shipping. Linking return data with inventory, sales channels, and customer feedback shows whether the problem comes from manufacturing, distribution, or handling.
When regional sales drop unexpectedly, diagnostic analytics examines sales alongside local market conditions, promotions, competitor activity, seasonal trends, and customer behaviour. This helps determine if declines are due to internal issues like stockouts or marketing effectiveness or external factors such as competitor actions or economic changes.
Enterprise operations
In enterprise operations, diagnostic analytics explains performance deviations. Rising employee attrition can be traced through patterns in departments, roles, management, and engagement scores. Linking exit surveys, performance metrics, and workforce demographics uncovers causes such as workload imbalance, limited career growth, or cultural issues, enabling targeted retention strategies.
Cost overruns and missed KPIs can be analyzed by examining spending patterns, resource allocation, vendor performance, workflow bottlenecks, project timelines, and cross-functional dependencies. This helps teams identify whether delays or overspending stem from inefficiencies, inaccurate budgeting, skill gaps, or misaligned priorities, allowing corrective actions to optimize performance and control costs.
IT/Systems
Diagnostic analytics is essential in IT and systems for understanding operational issues. Analyzing server logs, network activity, application metrics, and user behaviour helps determine whether outages stem from hardware failures, software errors, misconfigurations, or external security events. Spikes in application errors can reveal underlying problems, and linking them to code changes, system integrations, or unusual usage patterns allows IT teams to address root causes proactively, reducing downtime and improving stability.
Fraud anomalies can also be detected by examining transaction data, access logs, and historical activity. Identifying irregularities such as compromised accounts or policy violations enables teams to implement preventive measures, strengthen security, and reduce operational risk.
Future Trends
Natural language querying
Natural language querying is becoming increasingly conversational and context-aware, allowing users to interact with analytics platforms just like they would with a colleague. Instead of constructing complex queries, business teams can ask nuanced questions such as “Why did regional sales drop last quarter?” and receive precise, actionable insights, with the system understanding context, historical trends, and dependencies to provide more accurate explanations.
Human-in-the-loop collaboration
Human-in-the-loop collaboration ensures that AI-generated findings are validated by domain experts and analysts. While AI can process vast amounts of data and suggest root causes, human expertise adds context, intuition, and judgment, creating a robust decision-making process that blends computational power with real-world understanding.
Redefining Diagnostic Analytics Through Lumi AI
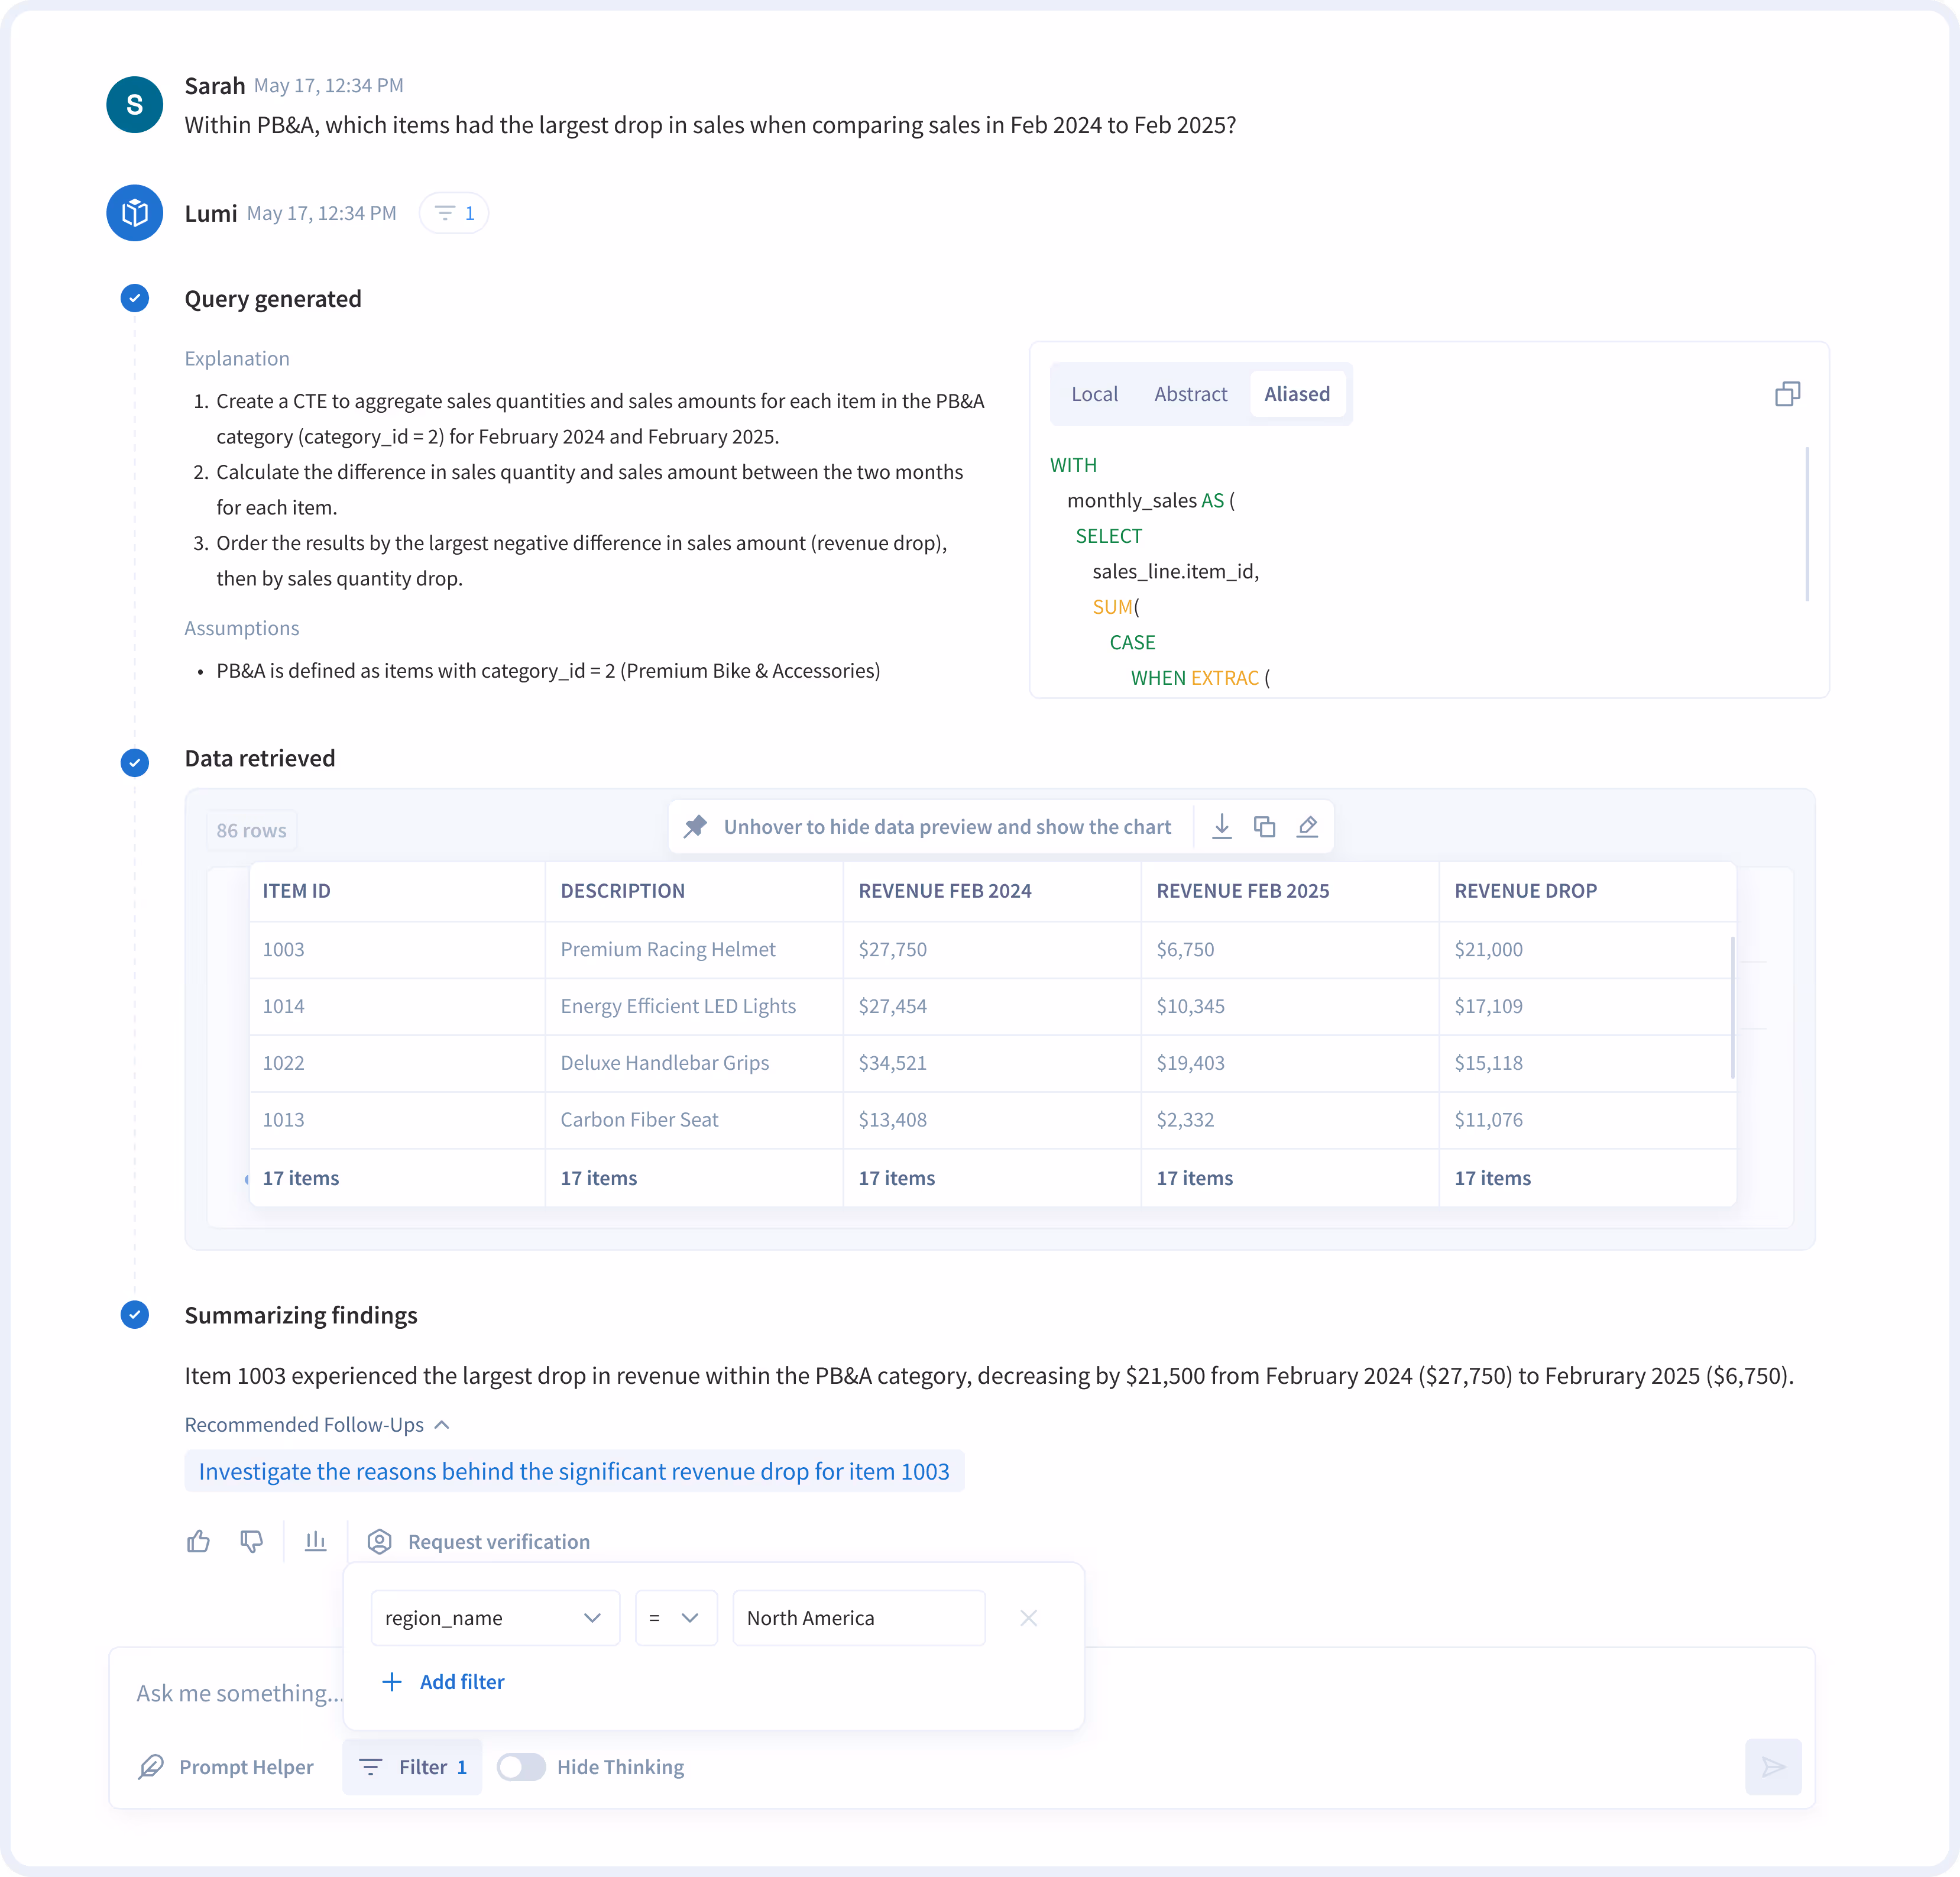
Lumi empowers businesses to harness diagnostic analytics without requiring deep technical expertise. Teams can ask plain-language questions like “Why did delivery times increase last week?” and receive immediate insights, eliminating the need to write SQL queries or Python scripts. Its automated anomaly detection identifies unusual patterns in operations and suggests hypotheses for why they occurred, guiding users toward actionable root causes quickly.
It democratizes access to data by providing intuitive interfaces that anyone in the organization can use, bridging the gap between business teams and analytics experts. Insights generated through diagnostic analysis seamlessly feed into predictive and prescriptive models, enabling organizations to not only understand why issues happen but also anticipate future trends and determine optimal actions.
Whether it’s supply chain delays, sales anomalies, or operational bottlenecks, Lumi provides clear, actionable guidance that drives efficiency, performance, and strategic advantage.
Turn your business data into actionable insights at enterprise scale. Request a demo today!
FAQs
Q1. What is diagnostic analytics in simple terms?
Diagnostic analytics is the process of analyzing data to understand why something happened. It goes beyond showing trends or patterns by uncovering root causes behind business outcomes, helping organizations turn observations into actionable insights.
Q2. What are examples of diagnostic analytics?
Examples include identifying why delivery times increased, explaining spikes in product returns, uncovering the reasons for regional sales drops, diagnosing warehouse bottlenecks, and investigating causes of employee attrition or cost overruns. Essentially, it answers the “why” behind operational, financial, or customer-related issues.
Q3. How does diagnostic analytics differ from descriptive and predictive analytics?
While descriptive analytics focuses on what happened and predictive analytics forecasts what might happen, diagnostic analytics asks why events occur. It bridges the gap between observing outcomes and anticipating future trends, providing the actionable insights needed before moving to predictive or prescriptive steps.
Q4. What are the main techniques of diagnostic analytics?
Key techniques include root cause analysis, hypothesis testing, correlation and regression analysis, and anomaly detection. These methods help pinpoint the factors driving observed outcomes and distinguish between coincidental patterns and actual causes.
Q5. Why is diagnostic analytics important in business?
It enables organizations to make informed decisions, optimize processes, reduce risks, improve customer experiences, and enhance operational efficiency. By understanding the root causes behind issues, businesses can implement targeted solutions, prevent recurring problems, and drive strategic growth.

Maria is a data analyst turned content writer with a strong foundation in data analytics. With her unique blend of technical expertise and creative flair, she specializes in transforming complex concepts into engaging, accessible content that resonates with both technical and non-technical audiences.


The New Standard for Analytics is Agentic
Make Better, Faster Decisions.

