
Business Intelligence
Retail Business Intelligence Essentials

The Essential Roadmap for Retail Business Intelligence: Metrics, Use Cases, and Actionable Strategies
Retail success relies on understanding customer demand, purchasing behaviour, and success factors across both physical and digital channels. Retail Business Intelligence (BI) delivers this by uncovering sales patterns, identifying inventory risks, and forecasting outcomes such as how a new store opening could increase online sales by nearly 7%.
At its core, Retail BI is the fusion of data, analytics, and decision-making across physical and digital commerce. It unifies sales figures, customer behaviour, inventory levels, and foot traffic into insights that leaders can actually use.
Retailers that use BI make decisions up to five times faster than those that don’t. And the global BI market is booming, projected to grow from $29 billion in 2023 to over $54 billion by 2030.
This blog will discuss what Retail BI is, how it works in practice, and why it’s reshaping the way modern retailers operate. We’ll see how BI helps retailers reduce decision fatigue, stay ahead of competitors, gain clear insights into omnichannel retail and make smarter decisions.
What is Retail Business Intelligence?
Retail business intelligence (BI) is all about using data from both in-store and online channels to make smarter business decisions. With BI, retailers can connect insights on customer behaviour, sales performance, and inventory movement into one clear picture to act on.
Modern BI ties together store-level and regional data to show how shopper traffic patterns and local trends influence performance. By linking where customers shop with what they buy, businesses are able to optimize store locations, forecast demand with more accuracy, and create strategies that bridge online and offline.
Already, companies that embed BI into their decision-making are 2.7 times more likely to outperform competitors in revenue growth.
Who Uses Retail Business Intelligence?
Retail business intelligence has become a core part of how modern retailers operate.
Store managers use it to track inventory, staffing, and daily sales in one place, keeping operations on track without disruptions. In merchandising, BI helps to compare product performance across online and offline channels so know exactly where to adjust assortments or pricing. On the marketing side, browsing and purchase data help to guide toward sharper campaigns and clearer promotion ROI.
For operations and supply chain teams, forecasts from BI make it easier to avoid stockouts and overstocks before they happen. Customer experience teams use foot traffic, conversion, and in-store behaviour data to refine the shopping journey so customers keep coming back.
At the executive level, BI brings together performance insights across regions and channels, shaping smarter investments and long-term growth strategies. Even real estate teams lean on BI when deciding where to open a new store or how big it should be.
Forrester reports that 62 percent of small and mid-sized retailers already use customer analytics for decision-making. And at the enterprise level, 53 percent of national and global retailers are using AI-driven BI for use cases like queue management and heat mapping.
Now, let’s look at how retailers apply this data intelligence to improve their business outcomes.
Why Retail BI is Important
Competitive and operational pressures
Retail operates with tight margins, where even small missteps in pricing, promotions, or stock allocation can erode profitability. Retail BI reduces this risk by delivering evidence-backed insights that guide smarter decisions across the business. It also tracks competitor actions and customer behaviour in real time, enabling timely adjustments before rivals respond.
Location-based data further shows which products perform best in specific areas, allowing retailers to tailor assortments, promotions, and pricing to local demand. Together, these strengths replace guesswork with precision and help safeguard margins in highly competitive markets.
Omnichannel and customer expectations
Retail BI ensures customers get the same pricing, promotions, and product availability whether they buy online, in-store, or through an app. It also addresses stockouts by tracking inventory in real time and using predictive insights to balance supply across locations before issues arise.
At the same time, BI makes personalization scalable by analyzing purchase history, browsing behaviour, and channel preferences to deliver targeted offers that drive loyalty and improve marketing efficiency. These capabilities work together to create reliable experiences, keep shelves stocked, and strengthen customer relationships.
Closing blind spots
E-commerce offers complete visibility into customer behaviour, with every click, scroll, and purchase tracked in detail. Traditional retail, by contrast, has long struggled with blind spots. Retail BI closes this gap by integrating offline data with digital insights, creating a unified view of performance across channels.
Through location analytics, retailers can see which products sell in specific stores, how layouts influence purchasing, and where customer engagement is strongest. This level of clarity transforms physical retail into a data-rich environment, giving brick-and-mortar the same precision and optimization opportunities once exclusive to e-commerce.
From fine-tuning operations to elevating customer engagement, BI moves beyond dashboards into daily decisions. Let’s look at a few core use cases that show exactly where the value comes to life.
Outcomes of Retail Business Intelligence
Sharper inventory efficiency
Retailers that use BI for operational optimization report a 14.2% average reduction in operational costs over three years, achieved through strategic inventory placement, efficient warehousing, and enhanced demand forecasting. BI-driven inventory analytics also deliver 23% better turnover rates and 19% fewer overstock incidents, ensuring capital isn’t tied up in products that don’t move.
By using BI to analyze real-time data and embed predictive supply chain intelligence, retailers can anticipate demand and optimize inventory so products are consistently available both in-store and online.
A holistic view of buying patterns
Retail BI provides insight for how sales, customer preferences, and inventory shifts play out across both digital and physical spaces. This unified lens makes it easier to identify where trends are forming and how they’re impacting performance regionally and across categories.
For example, by combining online browsing data with in-store purchase behaviour, retailers get a full-picture perspective, which helps balance online-offline strategies, and gives executives the confidence to invest in the right categories at the right time.
Research from KPMG shows that retailers who strategically apply analytics in areas such as merchandising, dynamic pricing, and supply chain management experience faster decision-making and greater agility in uncertain markets, proving the link between predictive BI and business resilience.
Clarity in decision-making with data
By consolidating information from customer behaviour, sales patterns, and inventory levels, retail BI equips leaders to validate ideas, test strategies, and adjust quickly when conditions shift. This minimizes costly mismatches between what’s stocked and what customers actually want, reducing both overstocks and frustrating out-of-stock scenarios.
Over 62% of retailers report that using analytics gives them a distinct competitive advantage, and in practice, this means moving from reactive fixes to proactive planning, where every decision is backed by evidence, not guesswork.
So far, we’ve focused on what retail BI makes possible - sharper decisions, stronger forecasting, better fulfillment. With these outcomes in mind, it’s time to look at the numbers - the key metrics that show how much impact they make.
Core Use Cases for Retail BI
Consumer behaviour insights
Cross-shopping analysis shows where shoppers jump between categories or brands, revealing opportunities for bundles or promotions that align with buying patterns. Journey context highlights friction points, such as customers abandoning carts online but completing the purchase in-store. Together, these insights provide a clear picture of how channels complement or cannibalize each other.
Segmentation further refines understanding by grouping shoppers based on demographics, behaviours, or engagement. When integrated with omnichannel monitoring, it shows how different segments interact across online and offline channels, supporting more precise personalization, improved retention, and increased conversion rates.
For example, Target, uses foot traffic and dwell time analytics to optimize staffing and store layouts. By analyzing visitation patterns, they’ve been able to adjust store hours, better align staff with customer peaks, and improve product placement to keep shoppers engaged longer, boosting both sales and customer satisfaction.
Market trend identification
Retail BI helps stay ahead of shifts in category and regional demand. By tracking category performance across different regions, businesses can identify where certain products are gaining traction and where they are underperforming. These insights guide more informed decisions on inventory allocation, marketing spend, and expansion strategies.
The full value emerges when BI incorporates external signals like weather, seasonality, or economic data. For example, temperature swings can directly affect apparel sales, like spikes in cold weather drive demand for jackets and boots, while heat waves boost sales of summer wear. With predictive capabilities built into BI, retailers can anticipate these shifts and stock accordingly, rather than reacting after shelves are already empty or overfilled.
Using BI, Walmart is able to forecast demand spikes tied to weather events. Ahead of hurricanes, for instance, BI signals prompt stores in affected regions to increase stock of emergency items like flashlights, bottled water, and batteries, ensuring shelves are full when customers need them most.
Competition benchmarking
Retail BI provides a clearer perspective on competitive positioning. By tracking shifts in market share and analyzing customer preferences, businesses can assess both their performance and the strategies of competitors. This insight enables proactive adjustments to pricing, promotions, and assortment strategies.
It also supports campaign tracking and sensitivity analysis. BI tools reveal whether promotions attract new customers or primarily engage existing loyal shoppers. Upsell and cross-sell opportunities become more visible by identifying which product bundles or offers perform best in each category. Data-driven adjustments allow for revenue growth without unnecessary promotional spending.
Walmart uses competitive intelligence analytics to monitor pricing and promotions at rivals like Target and Amazon. These insights let them adjust their own promotional cadence and ensure pricing stays competitive without eroding margins unnecessarily.
Advertising and promotions
Retail BI reveals both the volume and the profile of store visitors, highlighting what motivates their purchases. By combining footfall data with demographics and psychographics, campaigns can be precisely targeted, enhancing engagement and avoiding unnecessary promotional expenses.
BI tools also provide insights into how shoppers interact with promotions across channels. By analyzing basket composition, channel responsiveness, and loyalty behaviours, retailers can identify which offers drive incremental sales and repeat visits. This enables more effective targeting, smarter upselling, and stronger customer retention.
Product pricing intelligence
Retail BI helps to track price sensitivity and elasticity to better understand how changes impact demand. By monitoring lost sales, retailers can identify when a product is priced too high, and by layering in competitor data, BI highlights whether customers are defecting to rival retailers because of pricing gaps.
It also supports smarter strategies for promotions, markdowns, and initial pricing. By combining abandonment signals, competitor benchmarks, and real-time cost data, BI enables retailers to set prices that balance competitiveness with profitability.
Inventory optimization
Retail BI gives a sharper lens into how inventory moves across multiple channels, helping to reduce shrink, track turnover, and monitor stock health in real time. With this visibility, retailers can keep the right amount of product flowing through stores, warehouses, and e-commerce fulfillment centers.
It also strengthens replenishment planning and supplier performance benchmarking. By tying supplier data to demand forecasting, retailers can measure which partners consistently meet expectations and which ones create bottlenecks. End-to-end forecasting powered by BI brings all of this together, allowing companies to optimize inventory flows, reduce carrying costs, and deliver reliably across every channel.
Product assortment optimization
Retail BI makes it easier to separate winners from underperformers by tracking sales penetration, incremental contribution, and how products perform across different channels. Instead of relying on blanket assortments, BI shows which SKUs drive growth and which tie up shelf space without adding value.
On a larger scale, BI enables assortment planning across the organization, down to chains, stores, and even channels. That means assortments can be localized; what resonates in an urban flagship store might differ from a suburban outlet or an e-commerce channel. Retailers that actively optimize assortments using analytics see higher sell-through rates and better margins, as they’re aligning supply with what customers in each context actually want.
Sales intelligence
BI tools forecast future sales based on historical data, seasonal cycles, and external factors, giving leaders a reliable view of what’s coming. At the same time, team analytics and leaderboards help identify top performers, spotlight coaching opportunities, and keep sales staff motivated with clear benchmarks.
It also enables benchmarking across stores, product categories, and regions, making it easier to spot underperforming areas and replicate what works in high-growth segments. Basket analysis further enriches this picture by showing which products drive upsells and cross-sells, helping retailers fine-tune promotions and merchandising.
By now, we've seen how retail BI can be applied across products, pricing, supply chain, and sales. The real value, though, lies in the tangible benefits, insights that make the business more agile, efficient, and profitable
Key Metrics in Retail
This section will highlight some key metrics that can be used to get a clear understanding of retail business performance. For more information read a full supply chain in-depth kpi guide.
Sales and performance metrics
Sales and performance metrics track how revenue evolves over time, highlighting whether performance is improving, stagnating, or declining, helping assess long-term sustainability and competitive positioning.
- SPLY revenue: Same Period Last Year (SPLY) is a metric to compare apples-to-apples revenue changes for stores, items, departments, etc. This is calculated by comparing current sales against prior periods for the same stores.
- Sales per square foot: Sales per square foot is revenue divided by selling space, showing how effectively physical space generates sales.
- Year-over-year sales growth: Year-over-year (YoY) growth is calculated as (current period sales - previous period sales) ÷ previous period sales × 100. This clearly indicates sales trends.
- Multi-year CAGR: For growth metrics that extends the comparison across several years, often compound annual growth rate (CAGR) is used.
- Gross Margin Return on Investment (GMROI): GMROI measures profitability relative to inventory investment. It is calculated as gross margin ÷ average inventory cost. This shows how much profit a retailer earns from every dollar invested in inventory. A higher GMROI signals that inventory is generating strong returns, guiding better buying and pricing decisions.
Customer and market metrics
Customer and market metrics assess how effectively a retailer attracts, engages, and retains customers, providing insight into loyalty, profitability, and long-term growth potential.
- Conversion rate: Conversion rate measures how many visitors complete a purchase compared to total visitors. It is calculated as (number of purchases ÷ total visitors) × 100.
- Retention rate: Retention rate tracks the percentage of customers who continue purchasing over a given period. It is calculated as (customers at end of period - new customers acquired) ÷ customers at start of period × 100.
- Average Customer Value (ACV): ACV is calculated as total revenue ÷ number of customers. It is used to measure the average revenue generated per customer in a defined timeframe.
- Customer Lifetime Value (CLV): CLV estimates the total revenue a business can expect from a customer throughout their relationship. A common formula is average purchase value × purchase frequency × average customer lifespan.
- Churn rate: Churn rate measures the percentage of customers lost over a period. It is calculated as (Customers lost ÷ customers at start of period) × 100.
Operational and supply metrics
Operational and supply metrics evaluate how efficiently resources are used across inventory, logistics, and store operations, ensuring profitability and resilience in the retail chain.
- Cost of Goods Sold (COGS): COGS is calculated as beginning inventory + purchases - ending inventory. It represents the direct costs of producing or purchasing goods sold within a given period, including materials and labour but excluding overhead expenses.
- Inventory turnover: Inventory turnover measures how many times inventory is sold and replaced in a period. It is calculated as COGS ÷ average inventory.
Common Pitfalls in Retail BI Implementation
Adoption
Adoption can falter when teams stick to old habits, avoid logging activities, or treat BI as “extra work.” The reality is that culture change is just as important as technology change.
Driving adoption means building BI into daily workflows and showing teams the direct benefits: faster decisions, fewer mistakes, clearer performance visibility. Consistency matters for this. When everyone references the same dashboards and logs their activity, data becomes a living resource instead of a static report.
Data quality
When records are duplicated, fragmented across systems, or just plain messy, the resulting insights may be misleading. That means important decisions, such as pricing, promotions, or inventory planning, could be made on faulty assumptions. Clean, centralized data ensures BI delivers an accurate view of the business rather than a distorted one.
Deduplication, standardization, and proper governance are the foundation here. By setting up processes that catch errors early and align data across departments, it ensures all teams are working from the same set of accurate data.
Integration
When e-commerce platforms, CRM, POS, and marketing automation tools don’t connect, silos form that obscure the full picture of retail operations. Integration is often difficult because these systems weren’t built to communicate.
Choosing tools with strong API capabilities and BI solutions designed for retail ensures all data converges in a unified framework.
This allows customer behaviour to be linked to sales outcomes, promotions to be tied to conversions, and each channel’s impact to be measured accurately, producing a coherent and reliable view of the business.
Cost considerations
Retail BI platforms come with a wide range of pricing models tied to features, scale, and deployment methods. The key is aligning BI spend with business priorities. That means understanding which features drive the most value, like advanced forecasting or real-time reporting, and choosing a model that matches business scale. Thinking about cost as part of strategy, not just expense, turns BI from a budget line item into an engine of profitability.

Best Practices for Success
1. Define goals, objectives, and leading KPIs that drive impact
A strong BI strategy begins with clearly defined goals. Start by setting high-level business objectives, then convert them into specific, measurable KPIs that can be monitored in real time. This approach ensures the BI investment focuses on actionable outcomes rather than just generating dashboards.
2. Create a unified view across channels
Retailers often juggle separate reports from e-commerce, stores, and marketing, which creates blind spots. Unifying reporting views across channels creates a consistent view that highlights opportunities, avoids duplication, and supports a smooth customer experience. Starbucks does this well by linking mobile app, in-store, and loyalty program data, giving them a full view of customer behaviour.
3. Establish governance and consistency for data quality
Without data governance, even the best BI tools can produce misleading results. Standardizing definitions, processes, and data sources ensures teams work with accurate, reliable information.
4. Change management processes
Technology alone doesn’t change behaviour, people do. Show teams how BI directly makes their work easier, whether it’s scheduling smarter shifts, reducing stock frustrations, or personalizing offers to customers.
5. Use AI and machine learning to stay ahead
AI and machine learning can forecast demand, flag churn risks, and personalize shopping at scale. Zara is a standout example, using AI-driven BI to align inventory with local preferences, which reduces waste and keeps customers finding what they want.
6. Connect BI to core retail systems
BI is only as strong as the systems it pulls from. Integrating with POS, CRM, e-commerce platforms, campaign management, and even IoT sensors expands the scope of insight. Nike has built this interconnected approach, tying e-commerce, in-store, and app data into BI so every decision, from supply chain to promotions, is backed by real-time information.
The Future of Retail BI
Analytics embedded into daily workflows
Retailers will integrate BI into everyday workflows rather than treating it as a separate dashboard. Store managers can monitor sales in real time, while marketers adjust campaigns as they progress, with analytics built into the tools employees already use. This approach ensures decisions are data-driven at every level, not only at the executive table.
Predictive, prescriptive, and AI-driven intelligence
Predictive analytics will forecast demand shifts, prescriptive insights will recommend the next best actions, and AI-driven models will automate personalization at scale. Retailers equipped with these capabilities can anticipate customer needs, reduce stockouts, and act proactively rather than reactively.
Blending physical and digital commerce insights
Future-ready BI will unify data from POS systems, e-commerce platforms, loyalty programs, and even IoT sensors to create a single, holistic view of the customer journey. This allows retailers to optimize everything from personalized offers to omnichannel inventory planning, ensuring a consistent experience wherever the customer shops.
Why Lumi Is Built for Retail Success
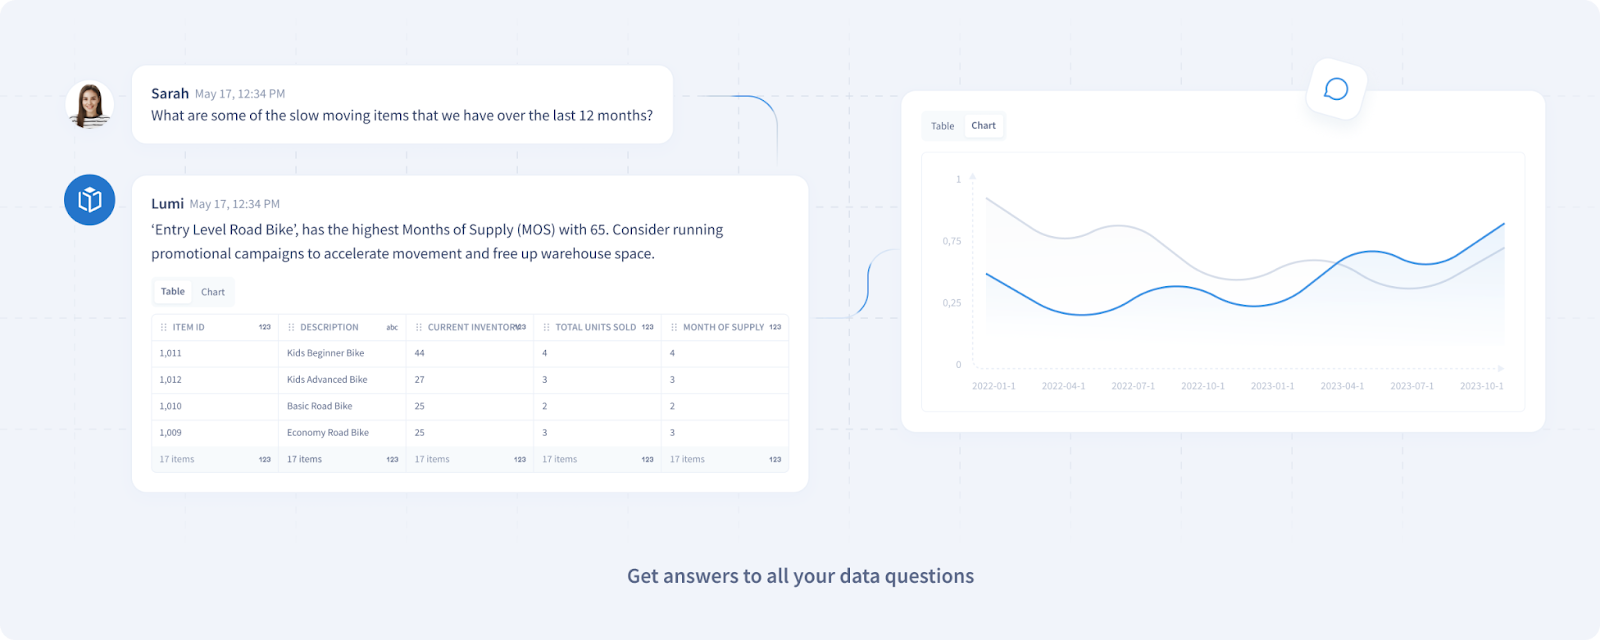
Retail BI today is all about having a single source of truth, real-time visibility, and business intelligence that is actionable, and that’s exactly what Lumi delivers. It connects directly with ERP and data lakes, ensuring all essential data is unified in one place without silos. This integration means updates are reflected instantly, giving teams the clarity they need to monitor performance, react to changes, and make informed decisions with confidence.
Ready to see Lumi in action? Request a personalized demo today and find out how to turn your retail data into smarter decisions.
FAQs
Q1. How would the retail industry use business intelligence?
Retailers use business intelligence (BI) to turn raw data into actionable strategies that boost sales, improve customer experiences, and streamline operations. BI tools allow retailers to track everything from in-store foot traffic to online browsing patterns, uncovering insights about what drives customer behaviour and where inefficiencies exist. With the right system in place, decisions around pricing, promotions, and inventory can be made faster and more accurately.
Q2. What should be analyzed for business intelligence in retail?
The most valuable BI analysis in retail spans three key areas: sales and performance (e.g., revenue per square foot, basket size, and margins), customer and market behaviour (e.g., conversion rates, lifetime value, and churn), and operational efficiency (e.g., inventory turnover, supply chain costs, and staffing alignment). A strong BI platform lets businesses track these metrics side by side to see the complete picture, connecting how customer demand impacts stock levels or how promotional campaigns influence margins. This holistic view is what helps retailers uncover growth opportunities while minimizing risk.
Q3. How do retail stores use business intelligence?
Physical retail stores use BI to make smarter, location-specific decisions. For example, footfall and dwell time data can shape staffing schedules, while regional sales trends can determine which products are stocked in different locations. BI also helps retailers measure how store layouts, promotions, and events affect customer engagement and conversion rates. With access to these insights, store managers can shift from relying on intuition to operating with evidence-backed strategies, maximizing revenue per square foot and reducing operational waste.
Q4. How should business intelligence information be used in the retail industry?
Using BI in retail comes down to putting insights into action. A retailer might use BI dashboards to flag a product at risk of stockout and reorder it before shelves run empty, or analyze customer behaviour to personalize promotions that increase repeat visits. On the financial side, BI can highlight underperforming categories, allowing teams to adjust pricing or negotiate better vendor terms. Solutions like Lumi take this further by making insights accessible in real time, empowering teams at every level to respond quickly to changing conditions.
Q5. How is business intelligence used in retail?
In practice, BI supports nearly every decision retailers make. It informs merchandising by showing which products are winners or laggards, guides marketing by revealing which channels drive the highest ROI, and strengthens operations by improving demand forecasts and supply chain visibility. Retailers also rely on BI to monitor customer sentiment, ensuring that brand perception aligns with their in-store and online experiences.

Maria is a data analyst turned content writer with a strong foundation in data analytics. With her unique blend of technical expertise and creative flair, she specializes in transforming complex concepts into engaging, accessible content that resonates with both technical and non-technical audiences.
.avif)

The New Standard for Analytics is Agentic
Make Better, Faster Decisions.

