
Business Intelligence
Alternatives to Power BI in 2026: 10 Tools Worth Switching To
.avif)
Organizations often reach a point where Power BI no longer fits their needs. Static dashboards limit users' ability to explore data on their own, and lengthy setup processes slow down time-to-insight. The security model can feel restrictive for certain governance requirements, while performance issues with large datasets create bottlenecks. When self-service capabilities fall short for non-technical users, teams start looking for tools similar to Power BI, or tools that go well beyond it.
This detailed guide walks through ten strong alternatives to Power BI and exhaustively shows how each one fits different situations. Some Power BI alternatives work better for small teams that want simple, flexible reporting. Others support enterprises with strict governance, complex data stacks, or real-time operational demands.
Quick Comparison: Power BI Alternatives at a Glance
What Is Power BI?
Power BI is Microsoft's analytics platform that helps teams turn data from spreadsheets, databases, and cloud services into reports and dashboards they can share across the company. It fits neatly into the Microsoft ecosystem, so organizations that already rely on Azure, Excel, or Teams usually find the setup smooth. Users get a wide range of visuals, automated refresh schedules, and a solid semantic layer that keeps core business definitions consistent across reports. It also scales well for companies that already manage their identity and permissions through Microsoft tools.
Its biggest strength is how easy it is to integrate with teams' existing stack, especially for teams that use Excel. The platform supports real-time dashboards, row-level security, and dataflows that feed cleaner data into reports. For companies rooted in the Microsoft stack, that combination of control, familiarity, and ecosystem integration often makes Power BI feel like the default choice.
Why Teams Look for Power BI Competitors and Alternatives
- Steep learning curve for advanced features: Users often mention that mastering DAX formulas, complex data modeling, or creating polished, presentation-ready visuals can take significant time and training.
- Rigid embedding and customization: Many teams find Power BI's embedded analytics options limiting, with little flexibility for product teams who want dashboards to feel native in customer-facing apps.
- Performance and scaling issues: Reviewers report slow refresh times, long query execution on large datasets, and difficulty optimizing performance when working with multiple sources or hybrid data environments.
- Complex governance and version control: Users note that managing dashboards, metrics, and reports across teams can become cumbersome, leading to shadow metrics, inconsistent definitions, and difficulty tracking changes in larger deployments.
Based on these common limitations, let's explore Power BI alternatives that address these pain points and cater to different team sizes, tech stacks, and analytics needs.
1. Lumi AI: Best Power BI Alternative for AI-First Data Exploration and Self-Serve Analytics
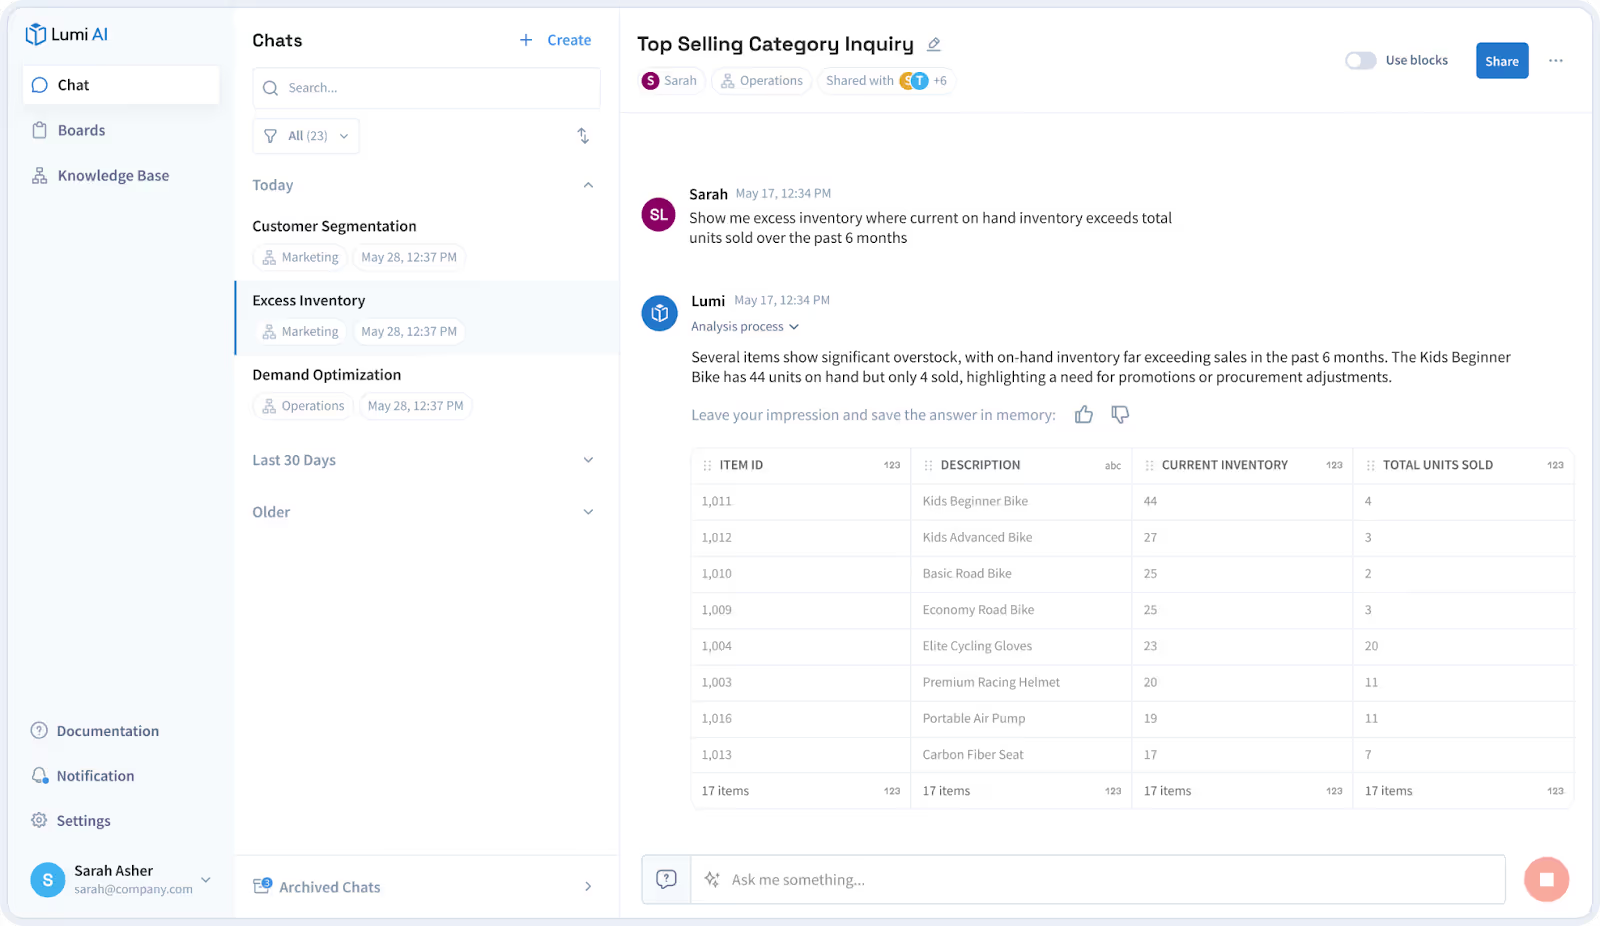
Lumi AI is built for enterprise teams that want a holistic enterprise business intelligence platform. It lets users ask questions in plain language and returns accurate answers drawn directly from company data. What makes Lumi stand out as a Power BI alternative is how flexible it is to ask questions and get answers instead of being locked into rigid dashboards. Lumi generates the SQL or Python needed to answer a question and runs it inside your secure environment. It also shows every step involved so analysts can review and validate the logic before sharing results. This approach removes the "black box" feeling that users sometimes experience in traditional BI tools and helps leaders trust the insights they act on.
Best features of Lumi AI
- Self-Service Analytics: Lumi enables every business user to explore data, ask questions, and create insights without relying on technical teams. Users can interact with data in natural language, generate queries automatically, and produce accurate results across complex datasets. This removes bottlenecks and supports fast, independent decision making.
- Advanced Context Management: Lumi automatically understands user intent, business rules, and organizational context to deliver accurate answers. The knowledge base stores field definitions, table relationships and context, along with business details, KPIs, or aliases so that insights reflect the true business meaning. This ensures precision, consistency, and high trust in all results.
- Human verification that brings analysts into the loop: Users like that Lumi shows the code, the reasoning, and the steps behind every answer. Analysts can check the logic before it reaches stakeholders, which builds trust and avoids the silent errors that happen when insights feel hidden.
- Fast insight generation that avoids dashboard clutter: Lumi cuts the time spent building dashboards for one-off questions. Instead of creating reports for every request, teams get answers directly from the data, which reduces backlog and lets analysts focus on deeper work.
- Transparent workflows that show how the AI arrived at an insight: Reviews highlight how helpful it is to see the entire workflow that produced a result. Users get a clear chain of actions, from interpretation of the question to SQL generation and execution, which makes the output easier to validate.
- Smooth collaboration that reduces repeat work: Teams mention how Lumi keeps conversations, queries, and verified insights in one place. When colleagues ask the same question later, Lumi can surface the validated answer instantly, which saves analysts from doing the same work twice.
Limitations of Lumi AI
- Initial user training required for advanced analysis: While Lumi uses simple language, users engaging in highly complex or specific analytical tasks may require brief training to learn the most effective ways to phrase their prompts, ensuring the system delivers the most precise results.
Lumi AI pricing
View more info on Lumi's pricing page:
- Standard: $50/user/month
- Pro: $75/user/month + platform fee
- Enterprise: Contact company for custom pricing
A lot of teams hit a ceiling with Power BI as they need answers that go beyond dashboards, so Lumi AI becomes the option that clears those roadblocks instead of adding more steps. Admins get clearer oversight because activity tracking, resource monitoring, and structured knowledge-base controls prevent the clutter and quiet workspace drift that Power BI users often deal with over time. Lumi even connects directly to major ERPs and warehouses out of the box, so the days usually spent wiring pipelines in Power BI turn into minutes for users to explore their operational data.
2. Tableau: Best for polished visual storytelling and complex visual analytics
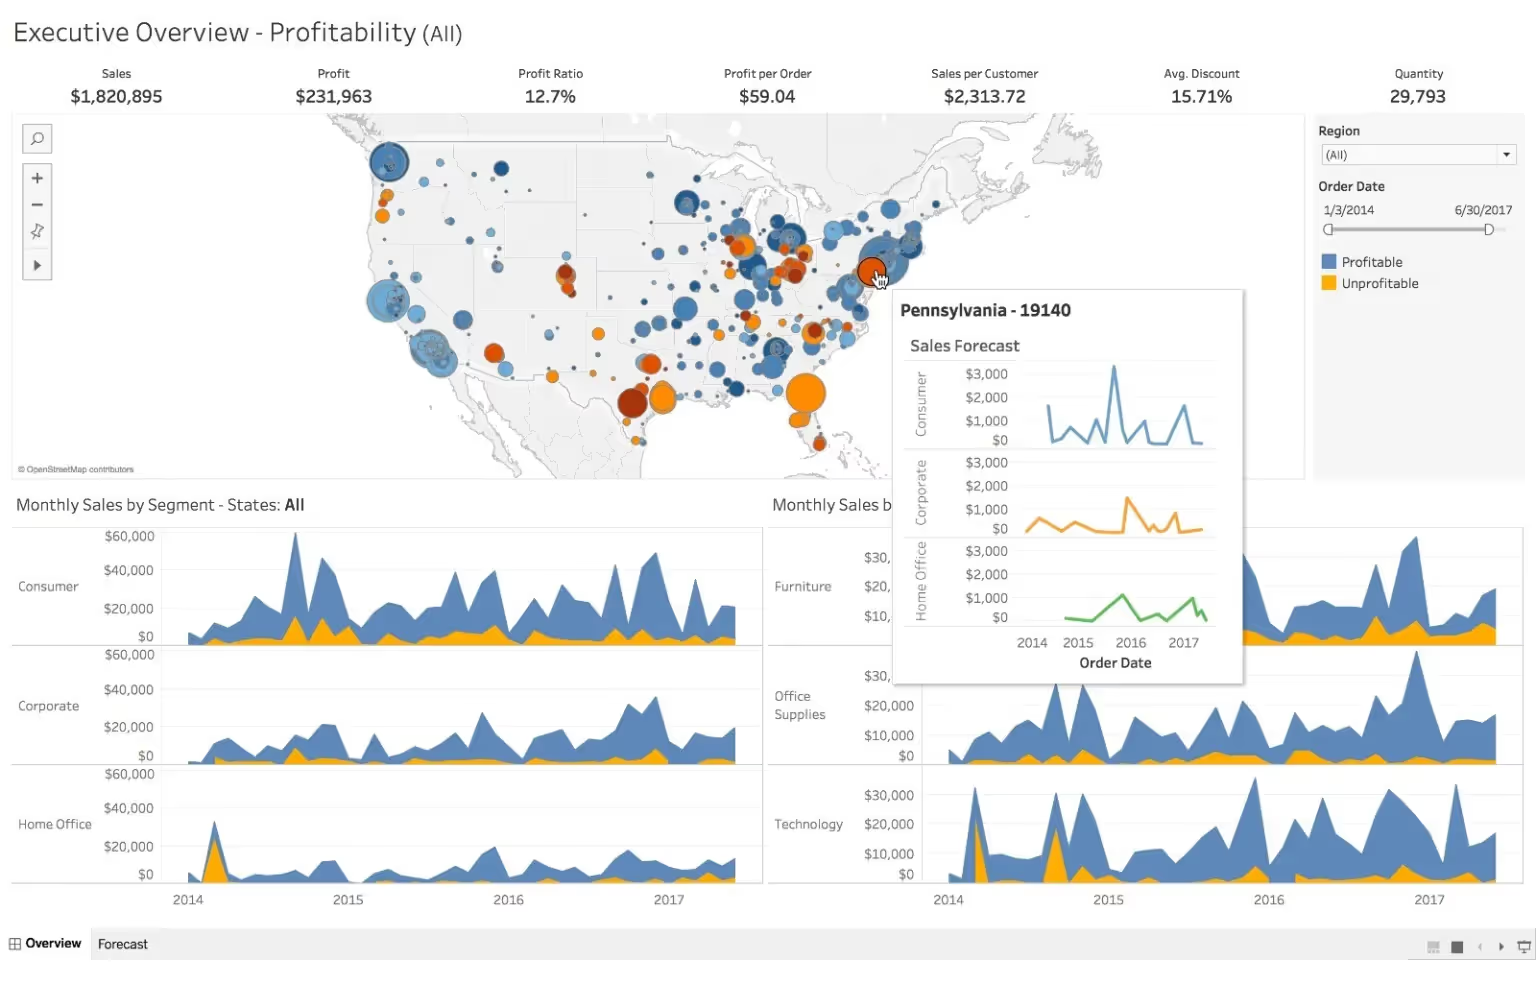
Tableau is a visual-first analytics platform that lets users build interactive dashboards with drag-and-drop ease while supporting complex data blending and calculations behind the scenes. As a Power BI alternative, it appeals to teams that need rich, highly customizable visualizations and intuitive exploration for both technical and non-technical users.
Best features of Tableau
- Stronger presentation-grade visuals: Tableau gives designers deeper control over layout, formatting, and visual styling, which helps when teams need dashboards that feel polished or highly customized.
- Better support for complex storytelling: Reviewers say its visual toolkit handles nuanced narrative flows and multi-step data stories more smoothly than Power BI.
- More intuitive drag-and-drop exploration: Many users say Tableau feels faster and more fluid for ad-hoc slicing, filtering, and data discovery without needing to build formal reports first.
- Flexible data blending: Reviewers note that Tableau handles multi-source blending in a more transparent and controlled way, which helps in workflows where Power BI's modeling rules feel restrictive.
Limitations of Tableau
- Higher cost: Users frequently mention that Tableau becomes expensive as seats and deployments grow.
- Heavier governance requirements: Teams report that managing permissions, content sprawl, and server configuration takes more effort than in Power BI.
Tableau pricing
Standard Edition:
- Tableau Public: Free
- Tableau Viewer: $15/user/month
- Tableau Explorer: $42/user/month
- Tableau Creator: $75/user/month
Enterprise Edition:
- Enterprise Viewer: $35/user/month
- Enterprise Explorer: $70/user/month
- Enterprise Creator: $115/user/month
Tableau ratings and reviews
Tableau gives teams more flexibility when working with large, live-cloud datasets because its VizQL engine can push complex queries directly to warehouses without forcing heavy semantic models or strict dataset structures the way Power BI often does. It also supports more open extensibility through JavaScript APIs and dashboard extensions, which helps teams embed interactive components or custom actions that would require workarounds or separate tooling in Power BI.
3. Looker: Best for governed, reusable data modeling and metric consistency
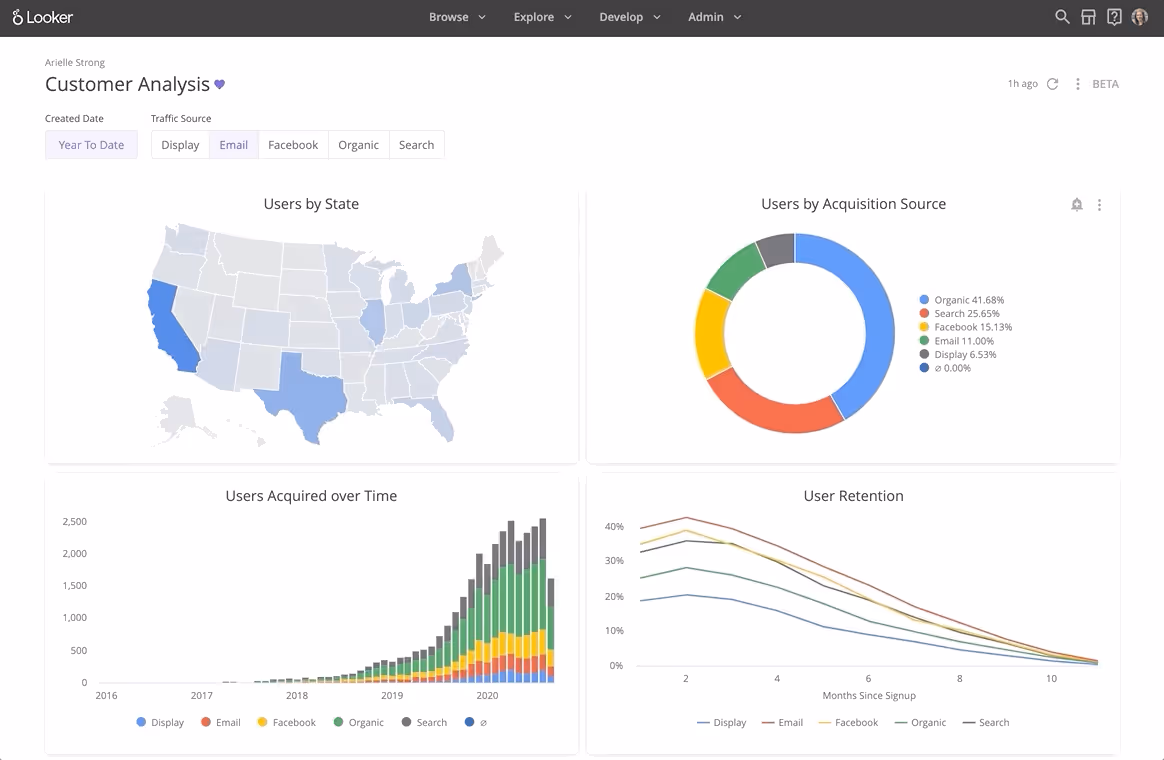
Looker is a cloud-first analytics platform that uses a modeling language called LookML to define metrics centrally, ensuring consistent calculations across dashboards and reports. As a Power BI alternative, it appeals to teams that want governed, code-driven analytics with flexible visualizations and seamless integration into modern data stacks.
Best features of Looker
- Centralized business logic: Looker's LookML modeling layer ensures that metrics are defined in one place, making them reusable and consistent across dashboards and teams.
- Improved metric governance: Reviewers highlight that centralizing logic reduces metric drift and errors, which helps maintain trust in self-serve reporting.
- Seamless integration with modern data stacks: Users appreciate that Looker connects easily to cloud warehouses like BigQuery, Snowflake, and Redshift, allowing teams to query live data without moving it.
Limitations of Looker
- Steeper learning curve for non-technical users: Teams note that mastering LookML and the modeling layer can take time, especially for analysts without coding experience.
- Limited offline or desktop access: Reviewers mention that because Looker is cloud-native, it lacks the offline report creation and desktop flexibility that some Power BI users are accustomed to.
Looker ratings and reviews
Looker provides a flexible API and embedded analytics framework that lets teams integrate live, governed data directly into custom applications, which Power BI often requires workarounds or separate services to achieve. It also supports advanced, reusable parameterized dashboards and scheduled data deliveries, enabling automated, dynamic reporting across multiple teams without manual intervention.
4. Sisense: Best for embedded analytics and custom app integrations
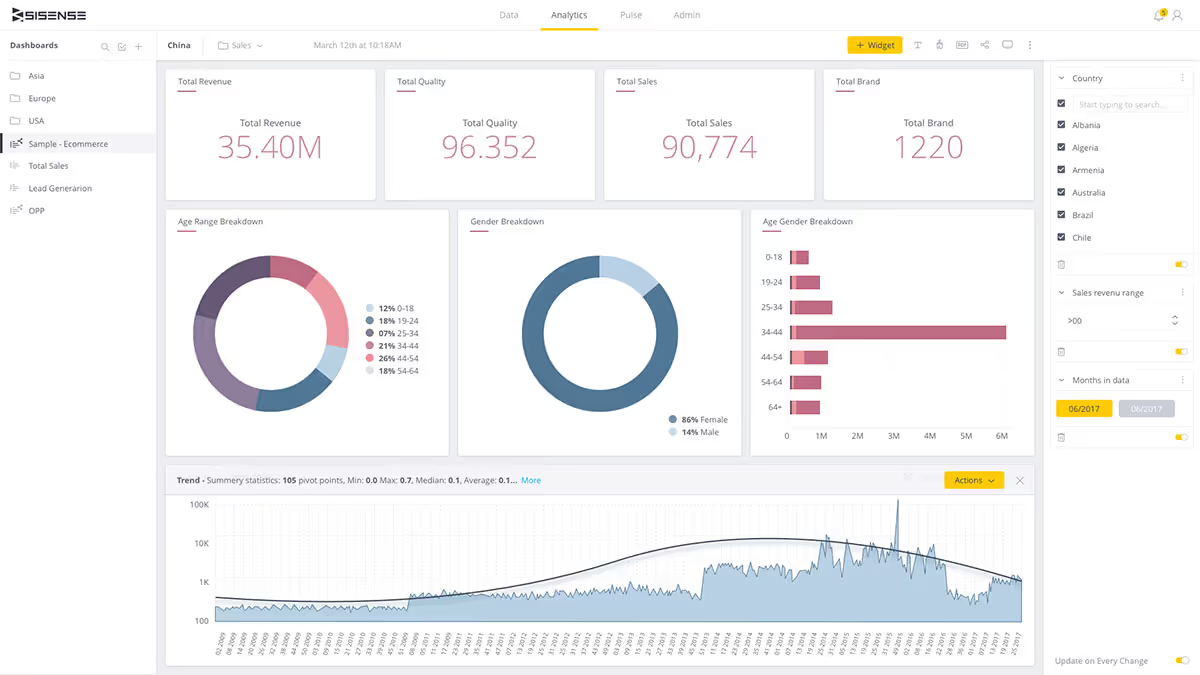
Sisense gives teams a full BI environment that handles data modeling, preparation, and interactive dashboarding in one place, and reviewers often note that it scales smoothly as datasets grow while offering a plugin ecosystem that expands visual capabilities without heavy rebuilding. As a powerbi alternative, it's especially appealing for companies managing multi-tenant setups or serving multiple clients because Power BI can feel rigid when teams need flexible workspaces, custom access rules, and clean data isolation.
Best features of Sisense
- Strong embedding capabilities: Users appreciate how well Sisense slots into customer-facing products, since the embedding framework feels stable and doesn't require complicated workarounds to make dashboards behave like native features.
- Developer-friendly APIs: Reviewers often mention that the APIs give engineers plenty of control over customization, so product teams can tune the analytics experience without wrestling with a rigid front end.
- Smooth product integration: People building SaaS platforms say the end-to-end integration feels predictable, which reduces frustration and shortens the time it takes to move from prototype to live embedded analytics.
- High embedded satisfaction among teams: Many user comments describe strong adoption and positive feedback from end users after embedding Sisense, especially when analytics needs to feel seamless inside an app.
Limitations of Sisense
- Opaque pricing: Reviewers regularly mention unclear or inconsistent pricing conversations, which makes budgeting harder and creates hesitation during procurement.
- UI rough edges: Some users note that parts of the interface feel dated or inconsistent, which slows down dashboard building and forces people to click around more than they expect.
Sisense pricing
Users have reported paying between:
- $50,000 for 50 users (no cloud hosting)
- $75,000 for 50 users (with cloud hosting)
Sisense ratings and reviews
Sisense addresses key pain points for Power BI users by offering full control over embedding, theming, and widget-level customization, letting dashboards feel native in customer-facing apps while handling hybrid data setups with fewer gateway issues. It also separates the data model from the presentation layer, provides clearer visibility into query performance, and supports more engineering-style automation, enabling teams to adjust models and workflows without disrupting dashboards.
5. Qlik Sense: Best for associative data discovery and fast in-memory analysis
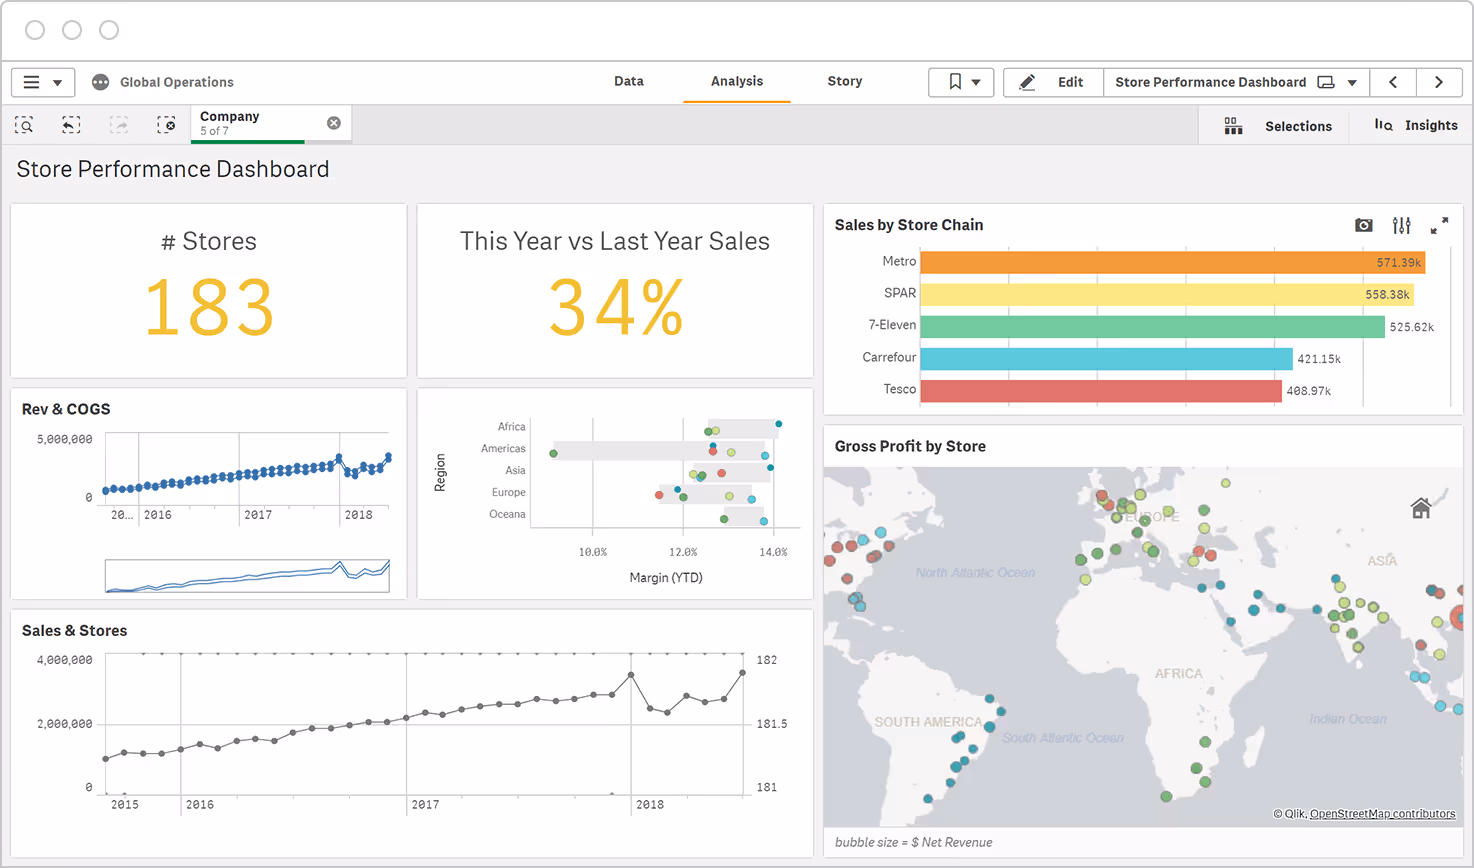
Qlik Sense is a self-service analytics platform known for its associative engine, which lets users explore data across multiple tables without getting stuck in rigid query paths, and reviewers praise its fast performance even with complex, high-volume datasets. As a Power BI alternative, it appeals to teams that need more flexible ad-hoc exploration and lateral analysis, helping users uncover insights that might be hidden in traditional, linear dashboards while maintaining strong governance and scalability.
Best features of Qlik Sense
- Associative engine for lateral exploration: Reviewers highlight that Qlik Sense's associative engine lets users navigate across multiple linked tables without predefined paths, making it easier to uncover hidden insights during ad-hoc analysis.
- Speeds up ad-hoc discovery and multi-angle filtering: Users appreciate that they can quickly slice and dice data from different angles, which accelerates exploratory analysis and reduces dependence on pre-built dashboards.
- Handles complex, high-volume datasets efficiently: Users frequently mention that Qlik Sense maintains strong performance even when working with large or highly connected datasets, allowing teams to explore data without lag or slow query times.
Limitations of Qlik Sense
- Steeper setup: New users report that the initial configuration and learning curve are higher than some other BI tools, requiring time to properly model data and understand the associative logic.
- More IT involvement required: Reviewers note that teams often need IT support to handle data connections, security, and initial setup, which can slow down adoption for smaller or less technical teams.
Qlik Sense pricing
- Starter: $200/month
- Standard: $825/month
- Premium: $2,750/month
- Enterprise: Contact for custom quote
A 30-day free trial is available.
Qlik Sense ratings and reviews
Qlik Sense provides robust storytelling and guided analytics capabilities that let teams create interactive narrative dashboards, a feature Power BI users often find limited or cumbersome. It also offers extensive audit and governance tools, giving organizations stronger control over data lineage, usage tracking, and compliance, areas where Power BI can require additional setup or third-party tools.
6. Metabase: Best for lightweight, open-source self-serve analytics
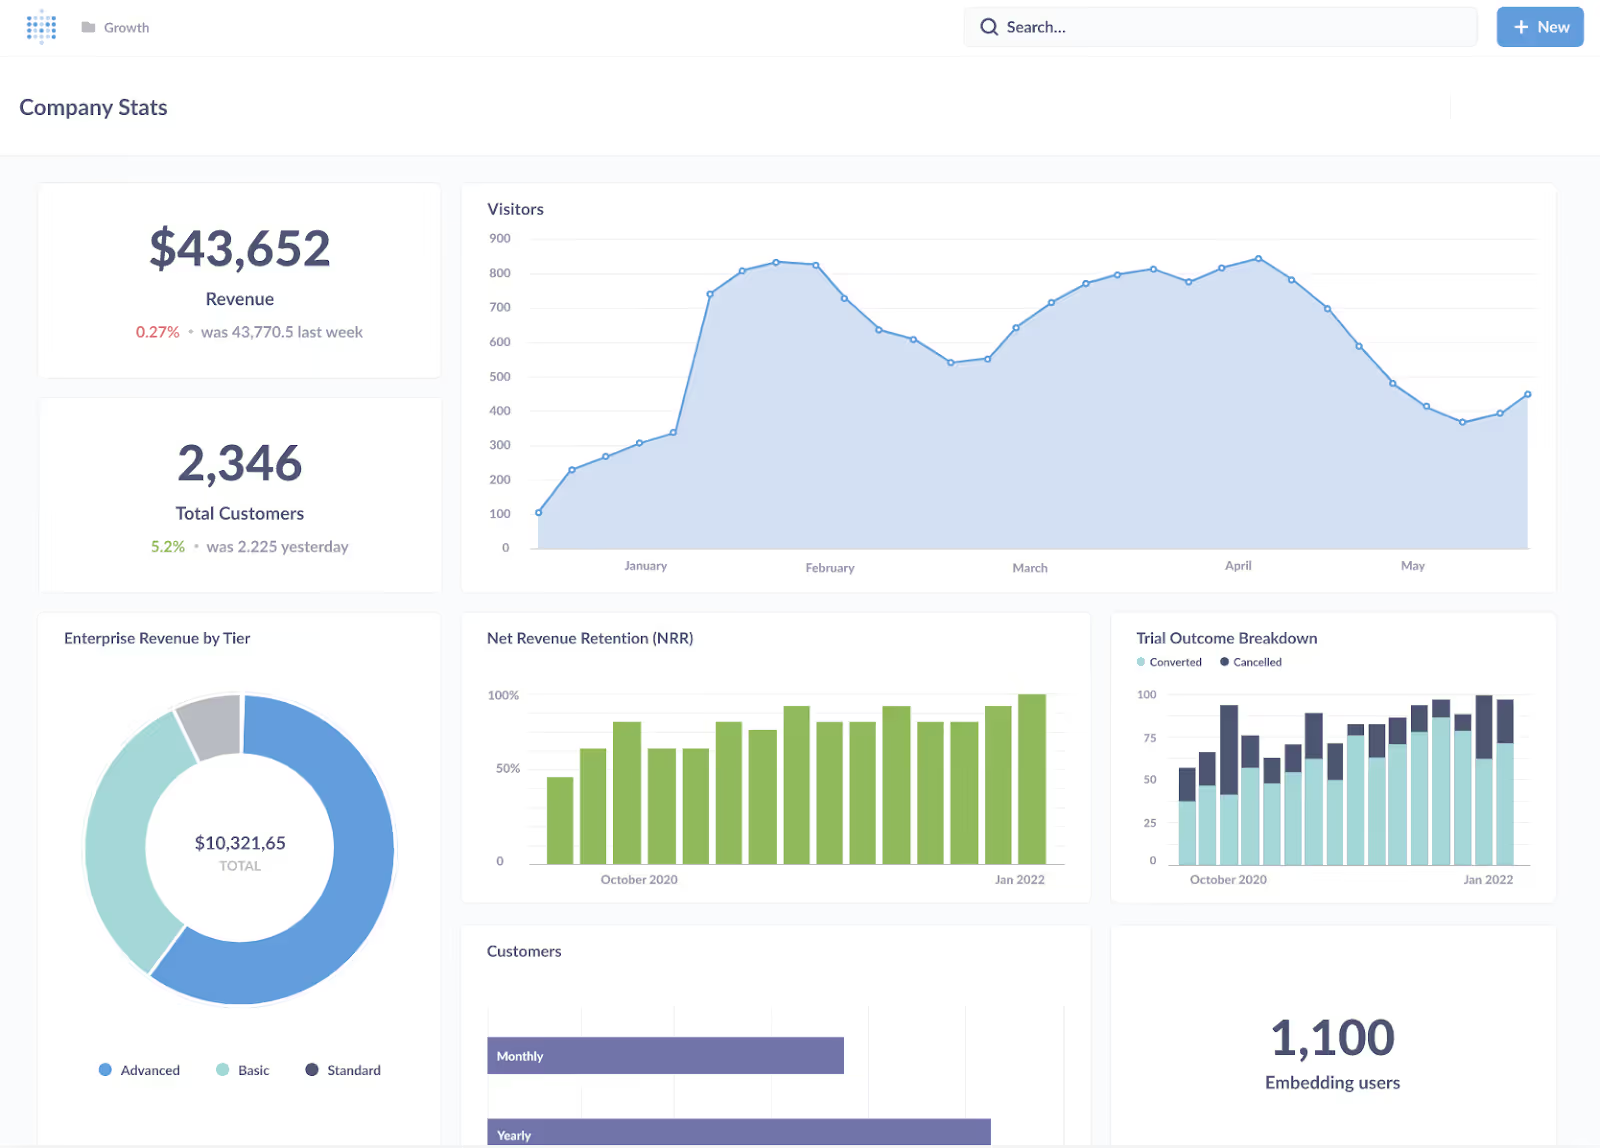
Metabase is an open-source, self-service analytics platform designed for teams that want quick insights without heavy engineering overhead, offering intuitive dashboards and a simple query builder for non-technical users. As a Power BI alternative, it appeals to small and mid-sized teams looking for fast setup, lightweight reporting, and straightforward SQL integration without the licensing complexity or steep learning curve of Power BI.
Best features of Metabase
- Fast, low-cost self-serve reporting: Reviewers highlight that Metabase lets small teams quickly generate dashboards and queries without heavy licensing costs, making it ideal for teams that need insights fast.
- Easy SQL/native query fallbacks: Users appreciate that while non-technical staff can use the GUI, analysts can still write SQL directly, providing flexibility for different skill levels.
- Quick setup: Many reviewers mention that installation and initial configuration are straightforward, so teams can start exploring data without long ramp-up periods.
Limitations of Metabase
- Limits on long-running queries: Some users report that Metabase can struggle with very large datasets or complex queries, which may lead to slow performance or timeouts.
- Limited enterprise-grade governance: Teams needing strong user management, audit trails, and compliance features may find Metabase insufficient for larger organizations.
Metabase pricing
- Open Source: Free
- Starter: $100/month + $6/month/user
- Pro: $575/month + $12/month/user
- Enterprise: Starts at $20k/year
A free trial is available.
Metabase ratings and reviews
Metabase allows full access to its open-source code, enabling teams to customize the platform, add plugins, or integrate unique features that aren't possible in Power BI's closed ecosystem. It also supports flexible deployment on any infrastructure, whether cloud, on-premises, or hybrid, giving teams more control over security, data residency, and IT policies than Power BI's primarily Microsoft-managed environment.
7. Domo: Best for full-stack, cloud-native BI with lots of connectors
Domo is a cloud-native BI platform built for real-time operations, giving teams a single place to connect data, automate workflows, and monitor performance through continuously updated dashboards. As a Power BI alternative, it appeals to organizations that need always-on data pipelines and broad departmental access without managing gateways or Microsoft-centric infrastructure, especially when speed and cross-team visibility matter.
Best features of Domo
- Cloud-first architecture: Teams say Domo handles heavy, multi-source workflows with fewer slowdowns, especially in scenarios where Power BI users run into refresh queue delays, capacity throttling, or peak-time concurrency issues.
- Large connector library: The built-in connectors cover a wide range of SaaS, databases, and marketing tools, so teams can automate full pipelines without stitching together third-party ETL services.
Limitations of Domo
- Higher cost: Many users note that Domo's per-user and usage-based pricing adds up fast for growing teams, which pushes total ownership costs beyond what they expected.
- Opaque pricing: Users mention that quotes vary significantly by customer, and the lack of transparent tiers makes it tough to predict costs or benchmark against Power BI.
Domo pricing
- Free 30-day trial
- Paid plans: Contact company for pricing
Domo ratings and reviews
Domo gives teams a built-in app framework that lets them turn dashboards into interactive, workflow-ready apps, something Power BI users often patch together with extra tooling. It also includes mobile-first authoring with real-time alerts, so frontline teams get instant updates without relying on desktop-based refresh cycles or manual configuration.
8. Lightdash: Best for dbt-native semantic layer and developer-led metrics
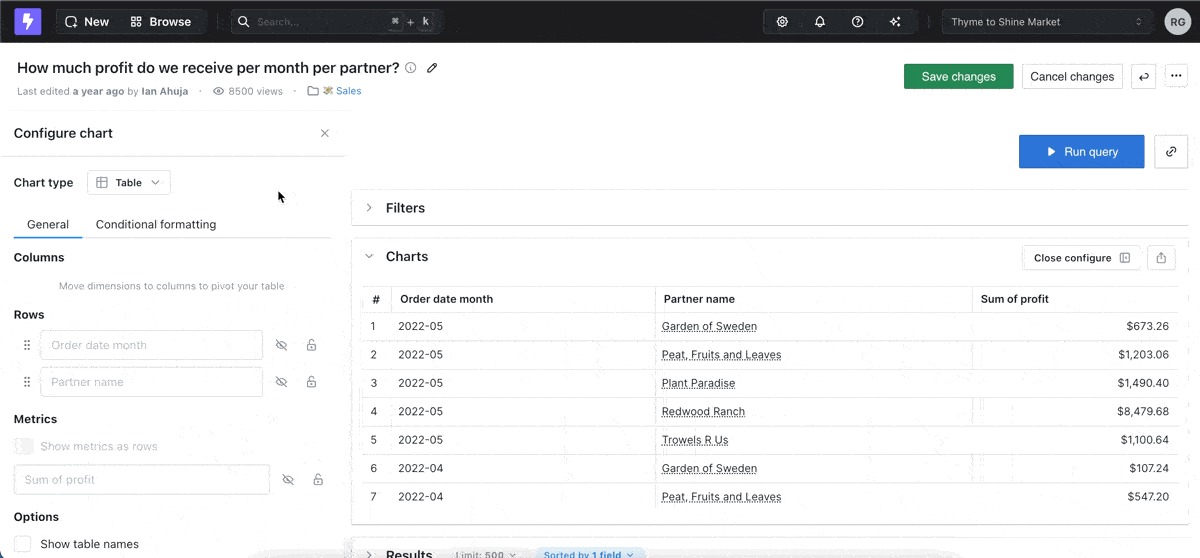
Lightdash is a BI tool that gives teams a clean way to turn their existing dbt models into a fully explorable analytics layer, so everyone works from the same definitions without the semantic-layer patchwork that Power BI setups often require. It runs in the browser, stays tightly connected to Git, and keeps changes versioned and transparent, which helps teams move faster and avoid the drift and duplication that tend to creep into Power BI workflows.
Best features of Lightdash
- Centralized metrics logic: Metrics stay tied to dbt models, so teams keep definitions in one place and avoid scattered, conflicting versions.
- Higher data trust: Reviewers say it reduces shadow metrics and boosts confidence in the numbers for teams already using dbt.
Limitations of Lightdash
- Limited fit for non-dbt teams: It doesn't suit teams that don't already work inside a dbt-based workflow.
Lightdash pricing
- Cloud Starter: $800/month (unlimited users)
- Cloud Pro: $2,400/month (unlimited users)
- Enterprise: Contact company for pricing
Lightdash ratings and reviews
- G2: 5/5 (16 reviews)
Lightdash gives teams full version control and transparent diffing on their analytics layer, so every change to a metric or dashboard can be tracked, reviewed, and rolled back in a way Power BI doesn't natively support. It also fits neatly into modern CI workflows, which helps data teams catch broken queries or failed transformations before anything reaches end users.
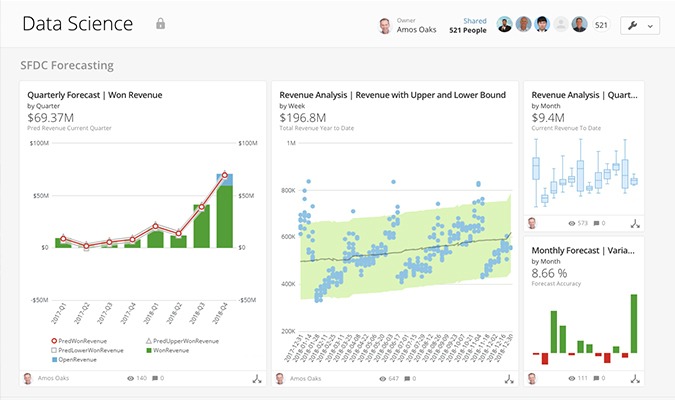
9. ThoughtSpot: Best for search-driven analytics and natural-language querying
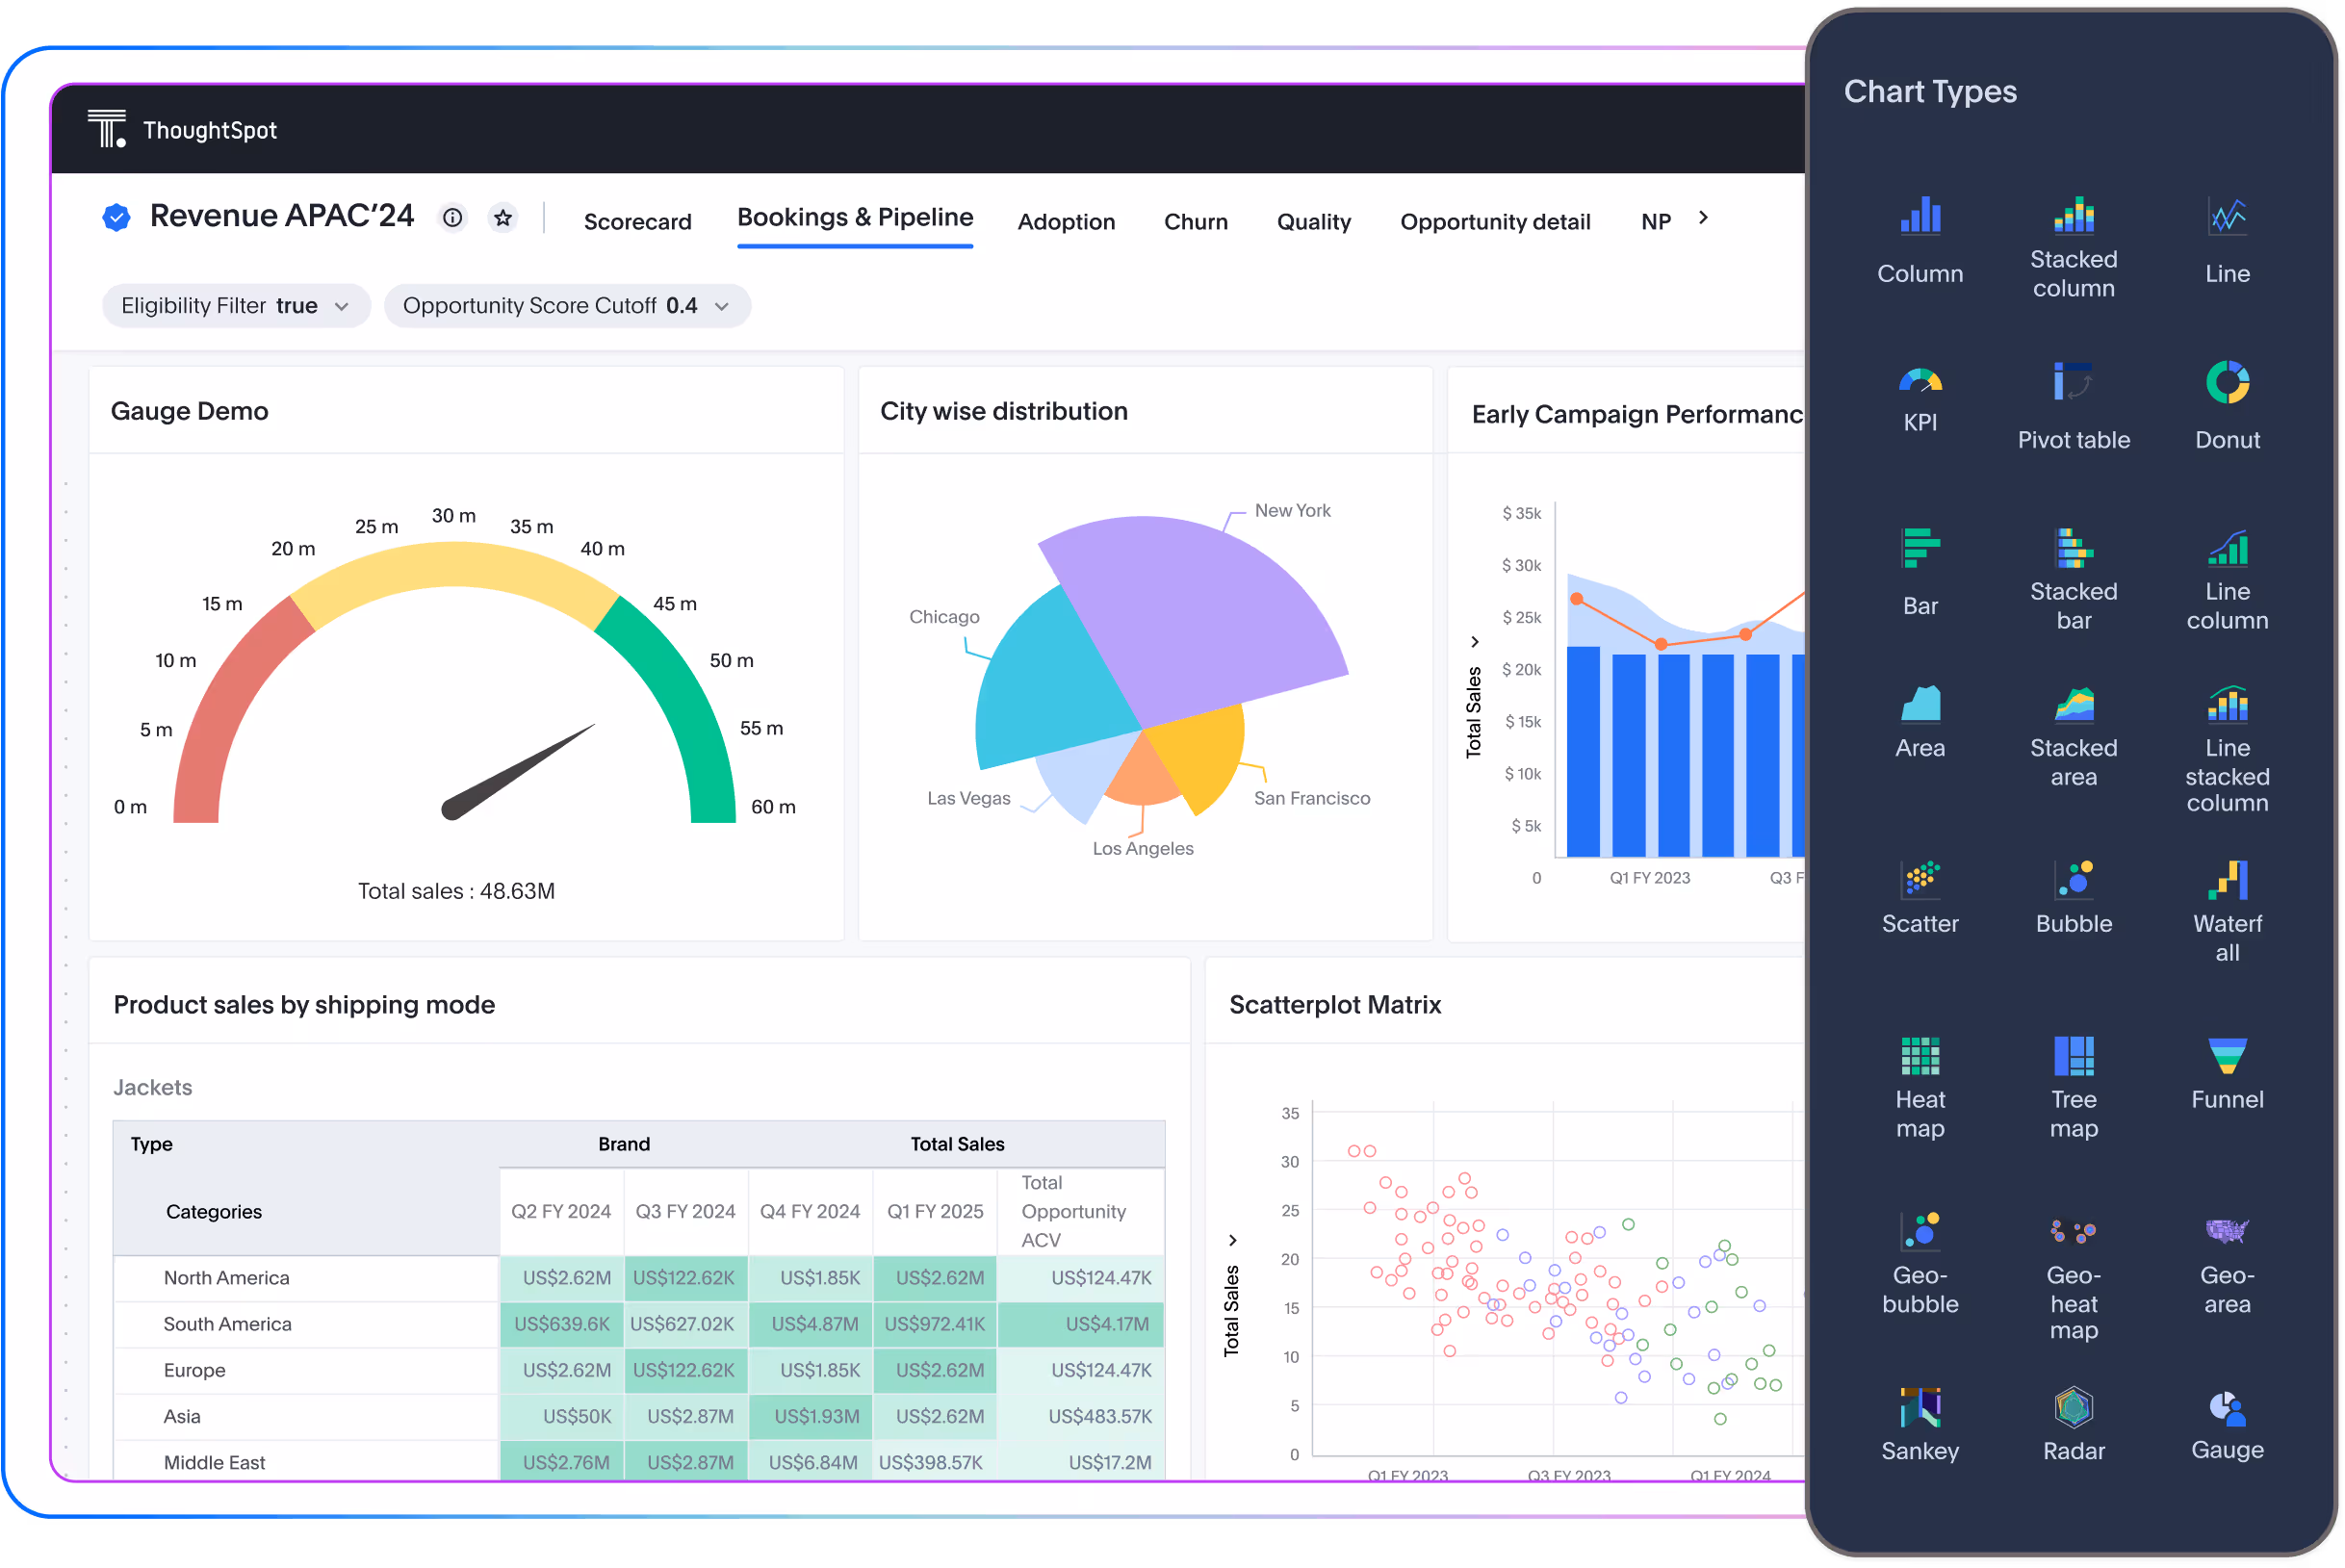
ThoughtSpot is a search-driven analytics platform that lets users type natural-language queries to get instant answers, making data exploration accessible without building complex dashboards or learning formulas. As a Power BI alternative, it appeals to teams that want fast, ad-hoc insights for business users, especially in environments where non-technical staff need to interact with data directly and get actionable results immediately.
Best features of ThoughtSpot
- Search-driven analytics: ThoughtSpot's interface lets non-technical users type plain-English questions and get near-instant answers, reducing reliance on DAX formulas or dedicated report authors.
- Fast ad-hoc insights: Reviewers highlight that the platform delivers quick results at scale, helping teams explore large datasets without long query delays.
Limitations of ThoughtSpot
- Limited embedded UI flexibility: Users note that customizing the look and feel of dashboards for embedding can be restrictive compared to other BI tools.
ThoughtSpot pricing
- Essentials: $25/user/month
- Pro: $50/user/month
- Enterprise: Contact company for pricing
ThoughtSpot ratings and reviews
ThoughtSpot provides automated insights powered by AI that surface trends, anomalies, and correlations without users having to build specific queries, which addresses Power BI's limitation in proactive, self-discoverable analysis. It also offers live connections to multiple cloud and on-premises sources simultaneously, allowing teams to analyze federated datasets in real time, something Power BI often requires extra setup or data modeling to achieve.
10. Amazon Quick Sight: Best for AWS-integrated, cost-effective analytics at scale
Amazon QuickSight is a cloud-native BI tool designed to integrate seamlessly with AWS services, letting teams create interactive dashboards and visualizations directly on top of Redshift, Athena, S3, and other data sources. As a Power BI alternative, it appeals to organizations already in the AWS ecosystem that want fast, scalable analytics without managing on-prem gateways or complex infrastructure.
Best features of Amazon QuickSight
- Seamless AWS integration: QuickSight connects natively to AWS services like Redshift, Athena, and S3, making it easy for teams to leverage existing cloud infrastructure without extra setup.
- Fast cloud scaling with SPICE: The in-memory SPICE (Super-fast, Parallel, In-memory Calculation Engine) lets users run queries quickly and handle growing datasets efficiently, supporting large-scale analytics in the cloud.
- Pay-as-you-go pricing: Reviewers appreciate the flexible cost model, which helps teams scale usage without committing to heavy licensing fees upfront.
Limitations of Amazon QuickSight
- Limited customization: Compared to tools like Tableau, QuickSight's visual and dashboard customization options are more restricted, which can limit highly tailored reporting.
Amazon QuickSight pricing
- Author: $24/user/month
- Author Pro: $40/user/month
- Reader: $3/user/month
- Reader Pro: $20/user/month
Amazon QuickSight ratings and reviews
Amazon QuickSight offers machine learning-powered insights, like anomaly detection and forecasting, directly within dashboards without requiring separate ML expertise, which addresses Power BI's limited built-in predictive capabilities. It also supports multi-account and cross-region AWS data access, allowing teams to analyze datasets from different AWS accounts or regions in a single dashboard, something Power BI typically requires complex setup or data replication to achieve.
Lumi AI Provides a Modern, Reliable Alternative to Power BI
For teams using Power BI who need faster insights without wrestling with DAX or waiting on modeling cycles, Lumi AI works alongside your existing setup to fill those gaps and extend what's possible. It combines AI-driven analytics with human verification, ensuring insights are not only fast but trustworthy and fully auditable. Lumi's knowledge-base approach, automatic SQL generation, and direct integration with existing data stacks streamline workflows that often get bogged down in Power BI. Whether your team struggles with ad-hoc questions or self-service analytics, Lumi delivers flexibility, accuracy, and transparency in one platform, making it the Power BI alternative teams want to switch to.
Book a demo with Lumi AI today and see how easily your team can move beyond Power BI.
Frequently Asked Questions: Alternatives to Power BI
What are the best alternatives to Power BI in 2026?
The best alternatives to Power BI in 2026 include Lumi AI (best for AI-first self-serve analytics and natural-language querying), Tableau (best for visual storytelling), Looker (best for governed metric modeling), Sisense (best for embedded analytics), Qlik Sense (best for associative data discovery), Metabase (best open-source option), Domo (best cloud-native BI), Lightdash (best for dbt teams), ThoughtSpot (best for search-driven analytics), and Amazon QuickSight (best for AWS-native teams).
Why do teams look for Power BI competitors?
Teams explore Power BI competitors for several reasons: a steep learning curve for DAX formulas, slow performance on large datasets, rigid embedding options that limit product integrations, complex governance that creates shadow metrics, and limited self-service capabilities for non-technical business users.
What tools are similar to Power BI?
Tools similar to Power BI include Tableau, Looker, Qlik Sense, Sisense, Domo, and ThoughtSpot, all traditional dashboard-and-reporting platforms. For teams that want AI-powered self-serve analytics layered on top of their existing BI stack, Lumi AI is a strong complement or full replacement.
Is there a free alternative to Power BI?
Yes. Metabase offers a fully free open-source version. Amazon QuickSight has a limited free tier. Tableau Public is free for work with publicly available data. For enterprise-grade needs, most Power BI alternatives require paid plans.
What is the best Power BI alternative for non-technical users?
Lumi AI and ThoughtSpot are the strongest choices for non-technical users because both let people ask questions in plain language rather than building formulas or learning SQL. Lumi additionally shows the reasoning behind every answer, which builds trust across business teams.
What are the best Power BI alternatives in 2026?
The list of best Power BI alternatives in 2026 is the same core set, with AI-native tools like Lumi AI gaining ground as teams shift from static dashboards to conversational analytics. The biggest shift from 2025 to 2026 is the rise of tools that combine a governed semantic layer with natural-language querying, reducing the need for dedicated BI developers for routine questions.

Maria is a data analyst turned content writer with a strong foundation in data analytics. With her unique blend of technical expertise and creative flair, she specializes in transforming complex concepts into engaging, accessible content that resonates with both technical and non-technical audiences.


The New Standard for Analytics is Agentic
Make Better, Faster Decisions.

