
Back to blog
Back to Case Studies
Upgraded Visualizations | Visually Compelling Insights

A New Visualization Experience in Lumi
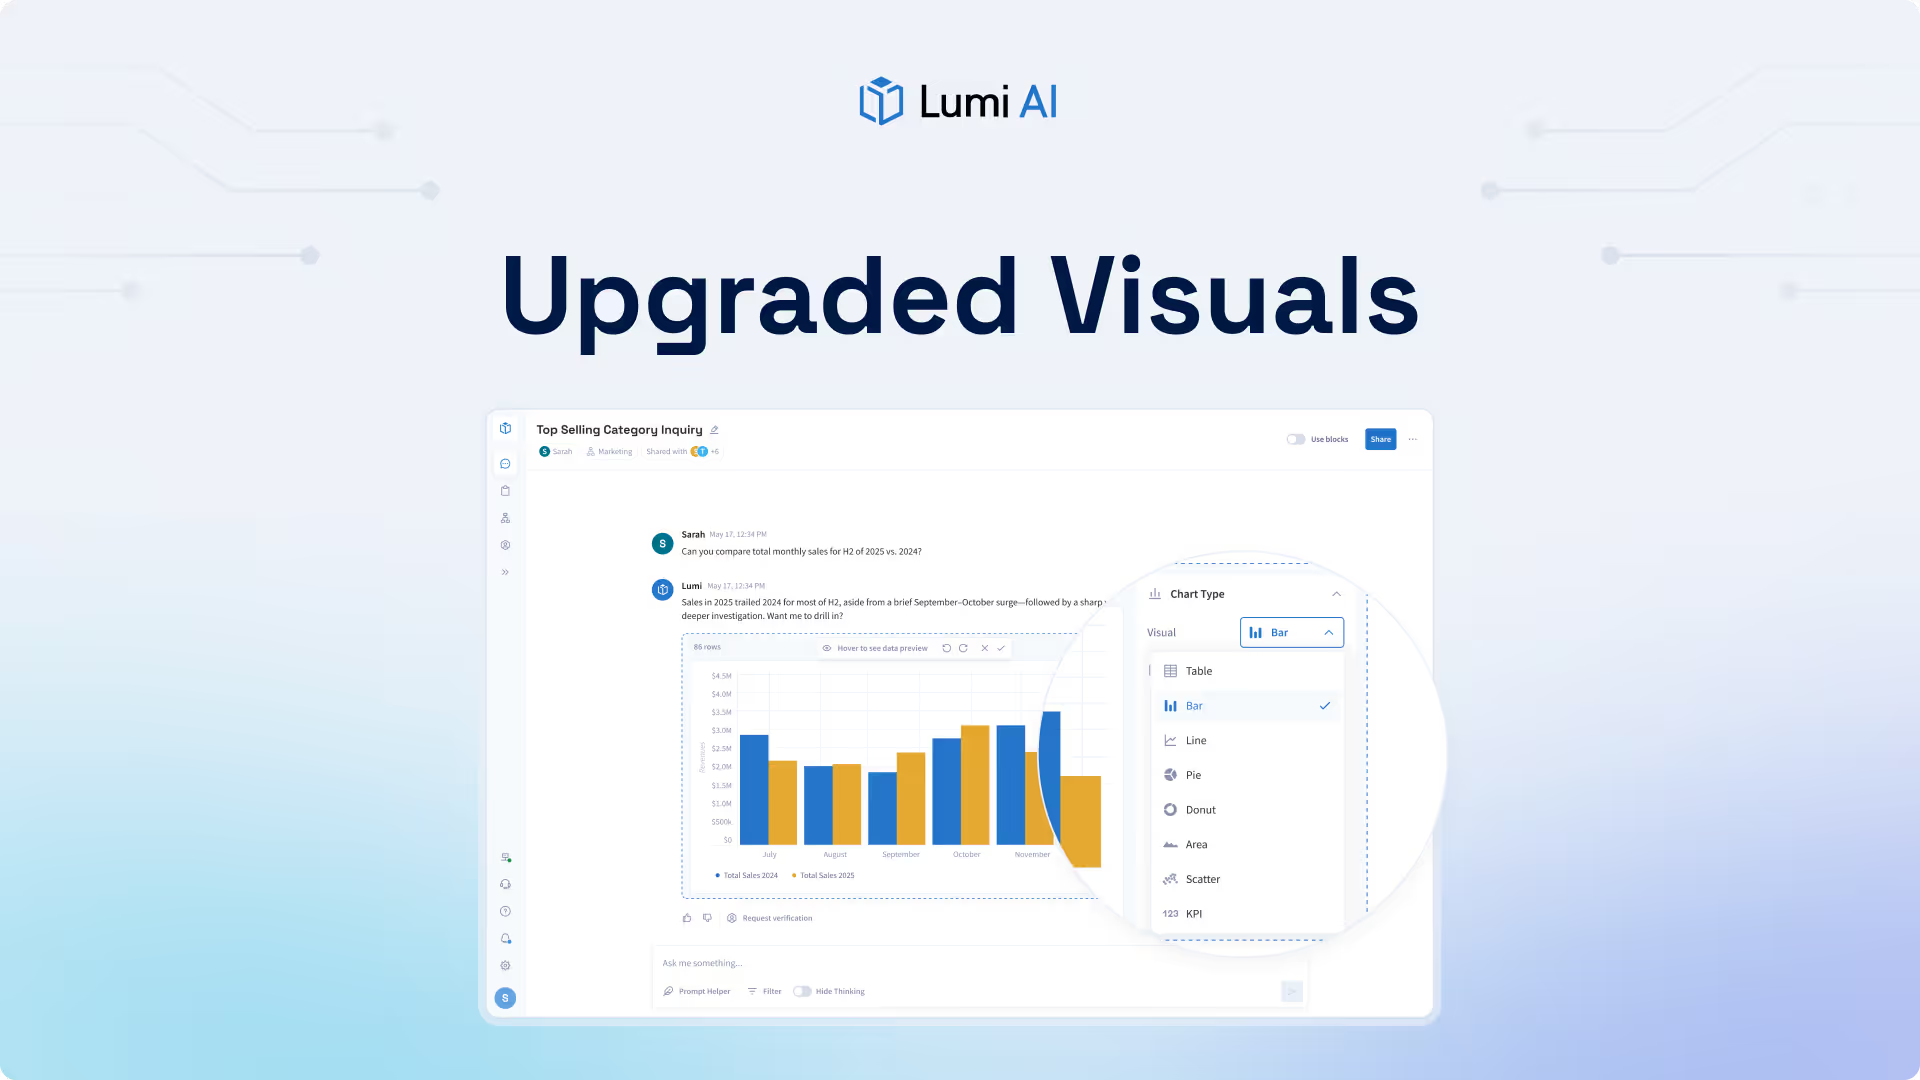
At Lumi, we are introducing an big enhancement to Lumi visuals, a complete upgrade to the graphing experience. This new product release makes it easier to create, edit, and share custom visuals directly within Lumi. With the latest visualization tools, Lumi gives you the freedom to design, refine, and present data your way, empowering you to explore insights that truly stand out. Lumi automatically and intelligently interprets your data, transforming it into visuals that uncover meaning at a glance.
What’s New
- Additional Chart Types: Choose from a wide array of chart types.
- Secondary Axes and Labels: Add secondary axes, titles, and labels.
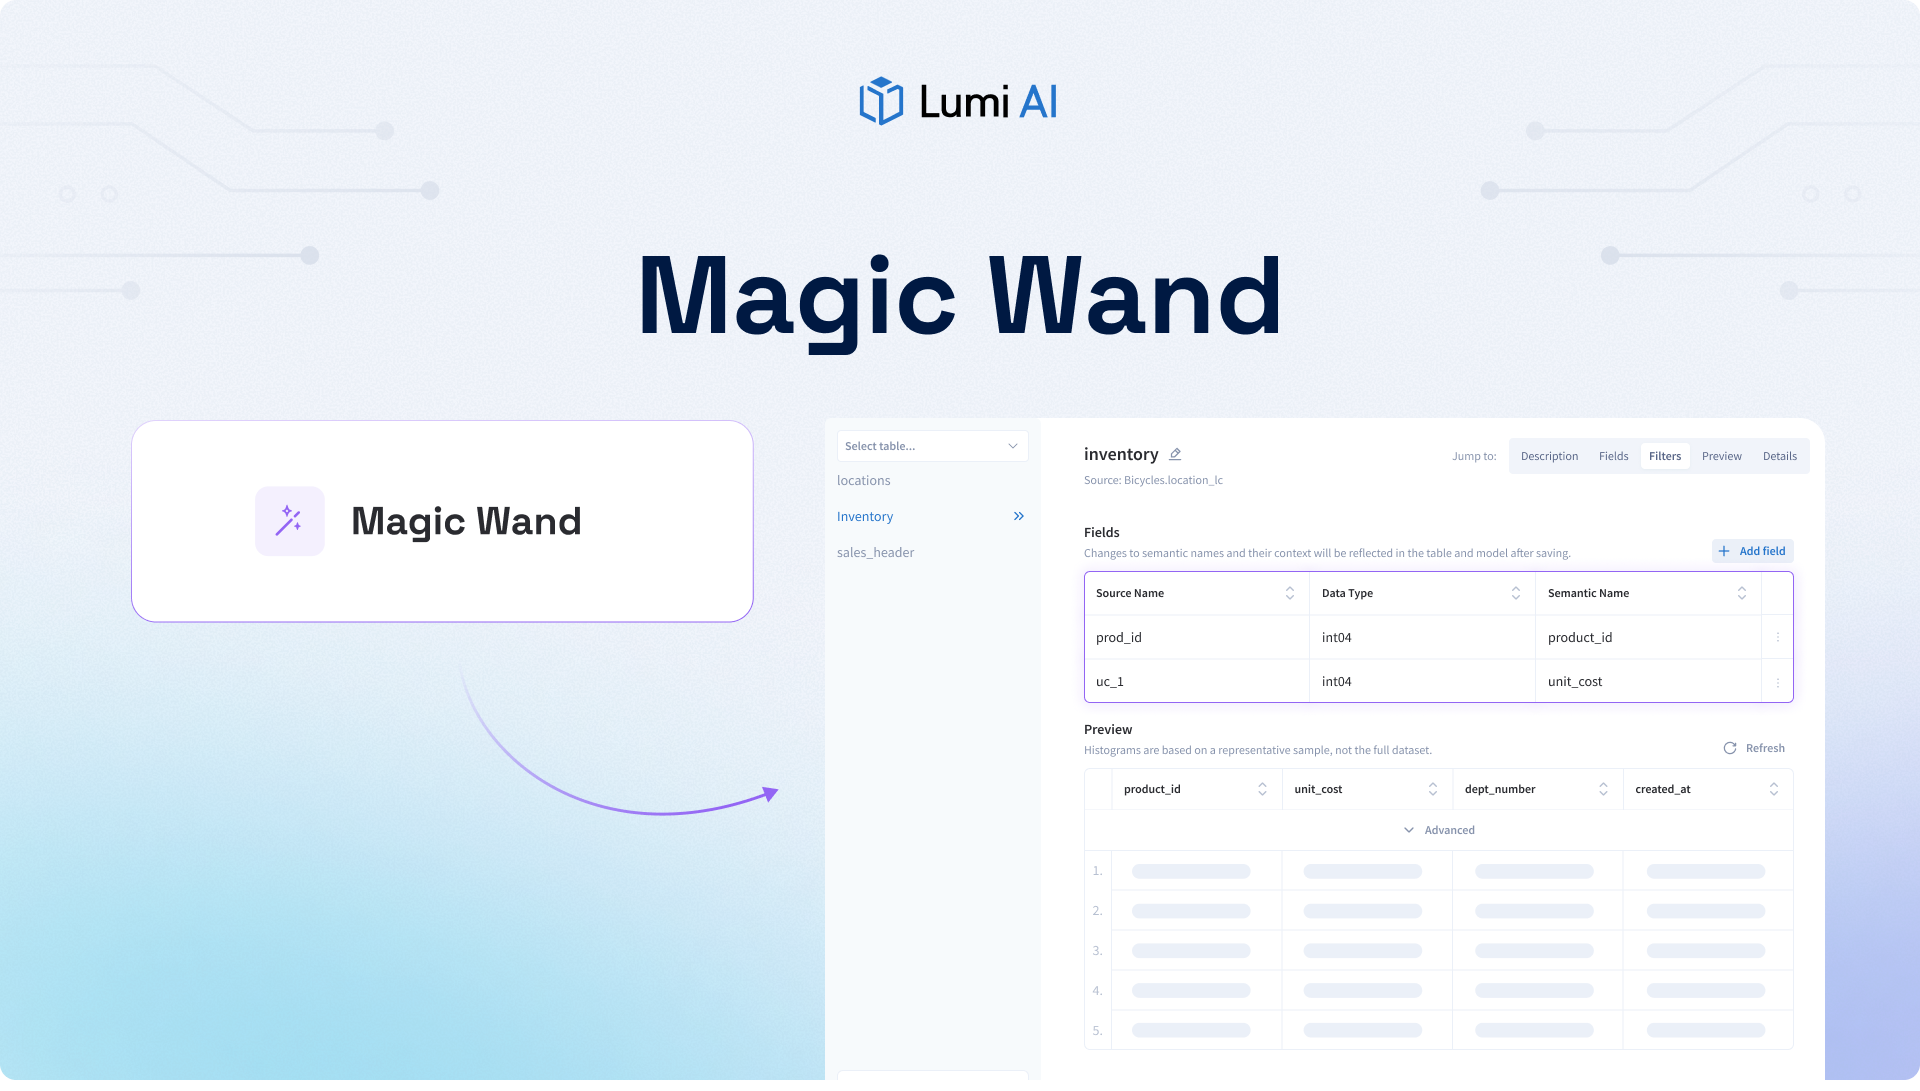
- Custom Formatting: Adjust colors and formatting to match your reporting style.
- Flexible Data Controls: Filter and sort data easily for precise analysis.
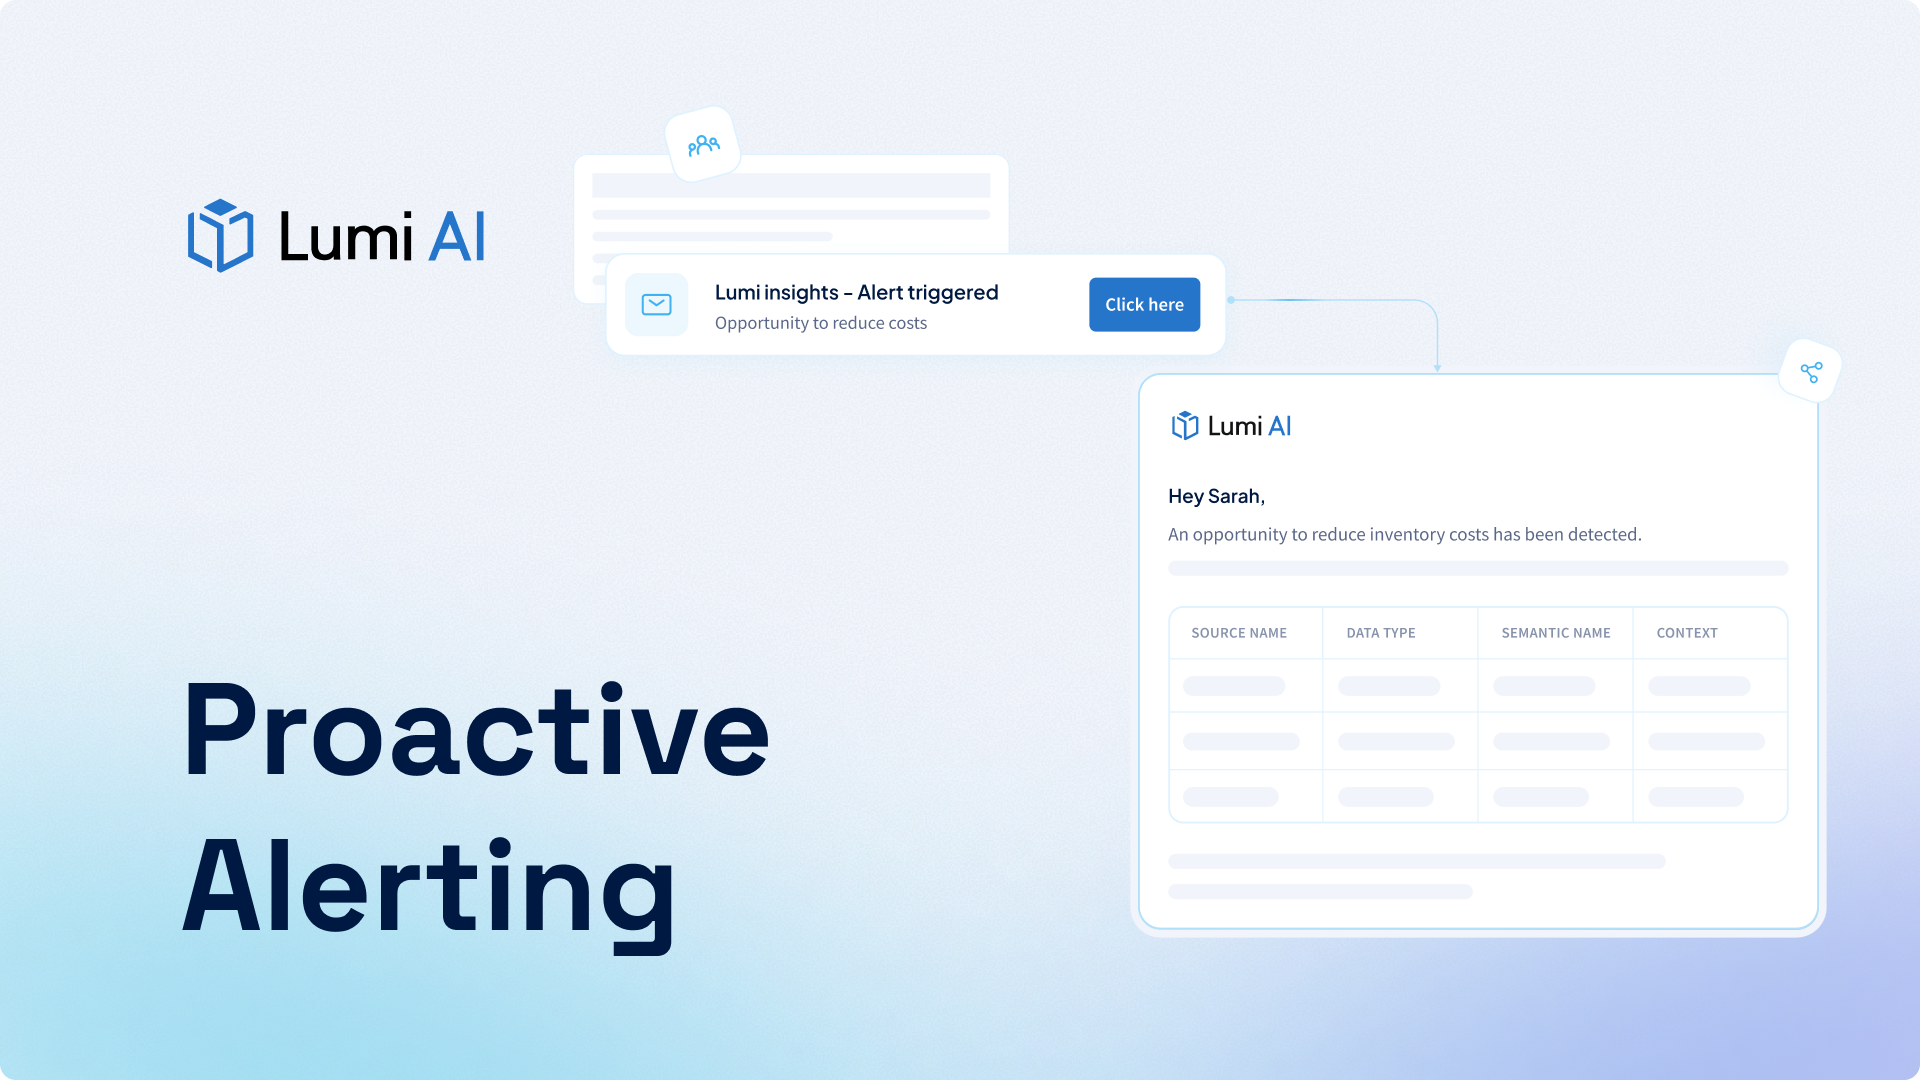
- Seamless Sharing: Export or pin charts to dashboards for easy access.
Your Data, Your Design
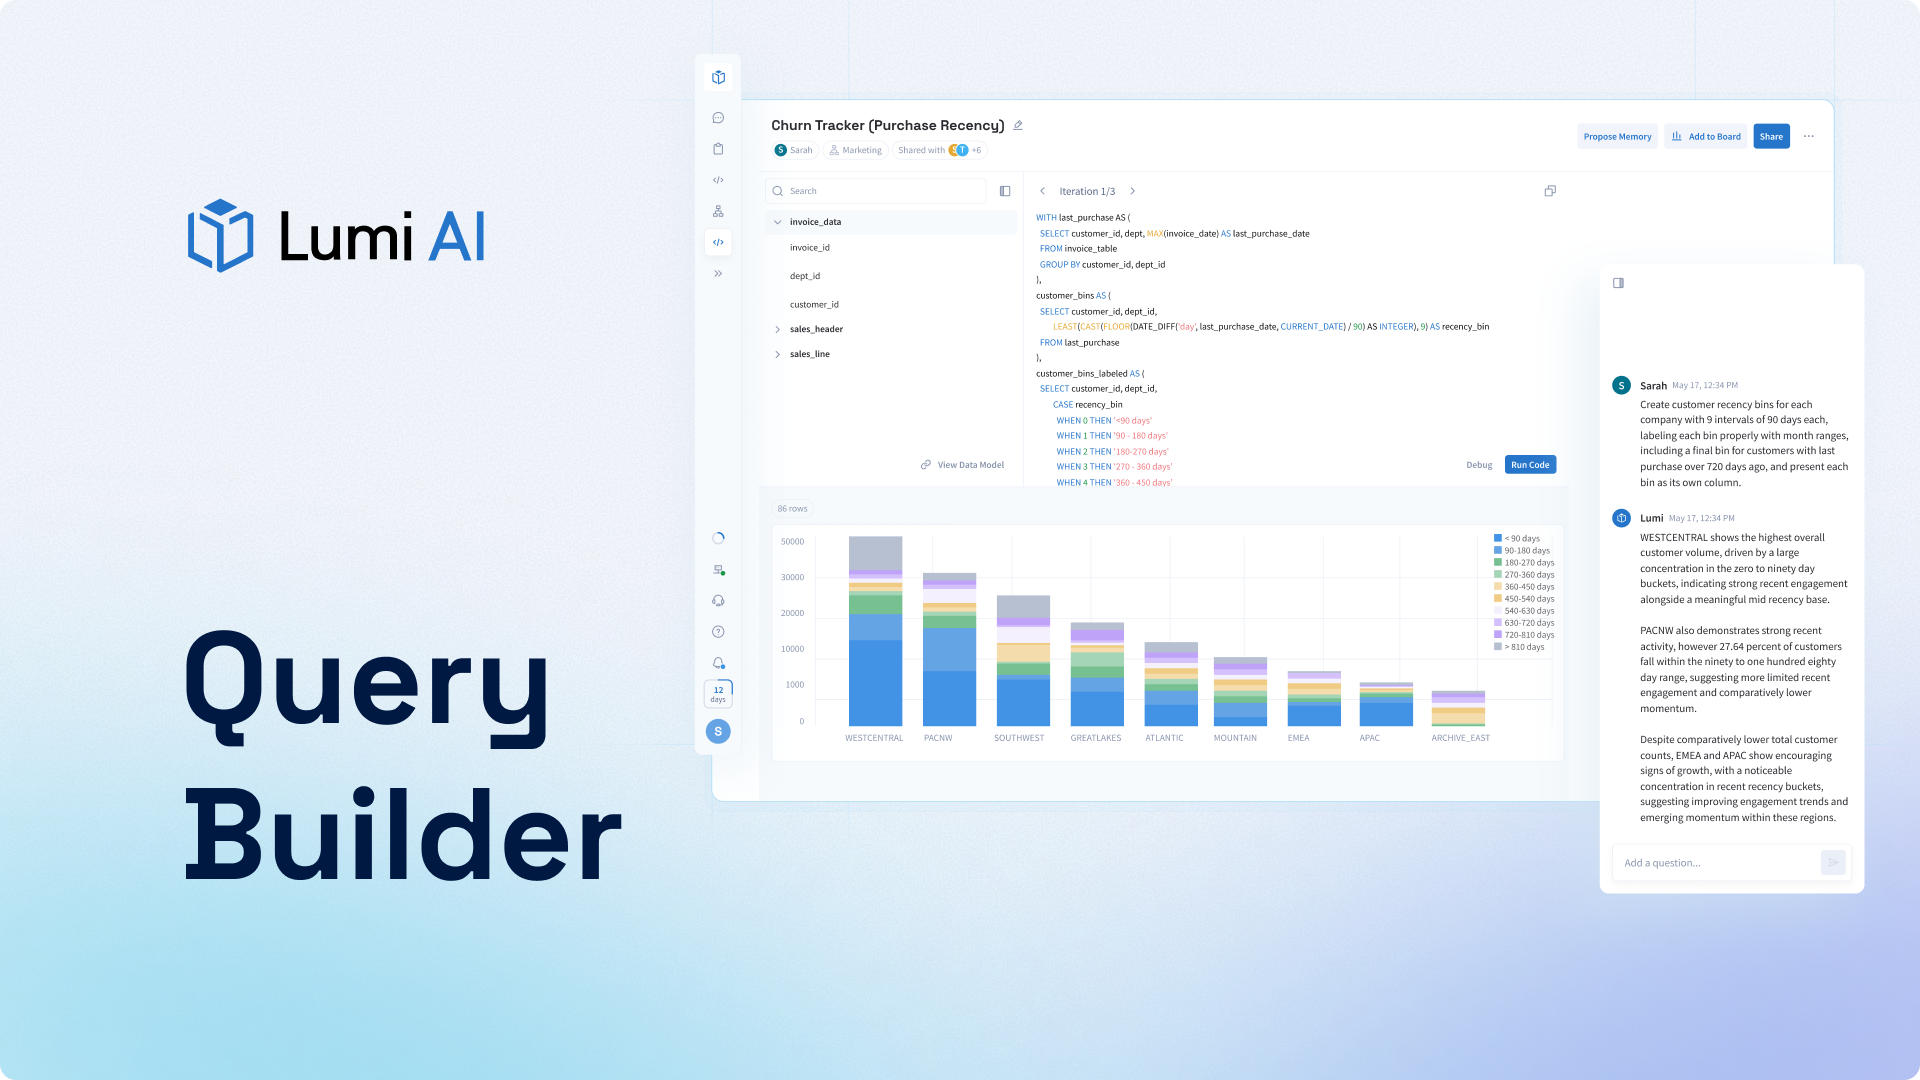
Lumi automatically interprets your data and presents your results in a visual format. From there, if you need to adjust it, you can add a final polish from a wide range of chart types whatever best tells your story. You can change layouts, adjust colors, and format labels to fit your audience or purpose. Whether building a recurring dashboard or preparing a quick report, every chart is clear, accurate, and tailored to your workflow.
A Shared View of Insights
With the new visualizations module, everyone sees the same picture. Teams can reference the same charts directly within Lumi, ensuring that discussions stay grounded in consistent data. It creates a shared understanding of performance and trends without needing separate dashboards or exports.
Built for What’s Next
Visualizations are a foundation for upcoming capabilities such as interactive dashboards, deeper drill-down views, and visual summaries. The goal is to make Lumi a place where teams can understand and present data in one workflow from question to visual answer.
Visualizations bring a clearer, more customizable way to explore and present data in Lumi.

Make Better, Faster Decisions.

Join Our Newsletter
Subscribe for the latest on self-service analytics, AI, and data-driven transformations.


