
Back to blog
Back to Case Studies
Metametrics | Smarter Data Exploration

Product Feature Release | Metametrics
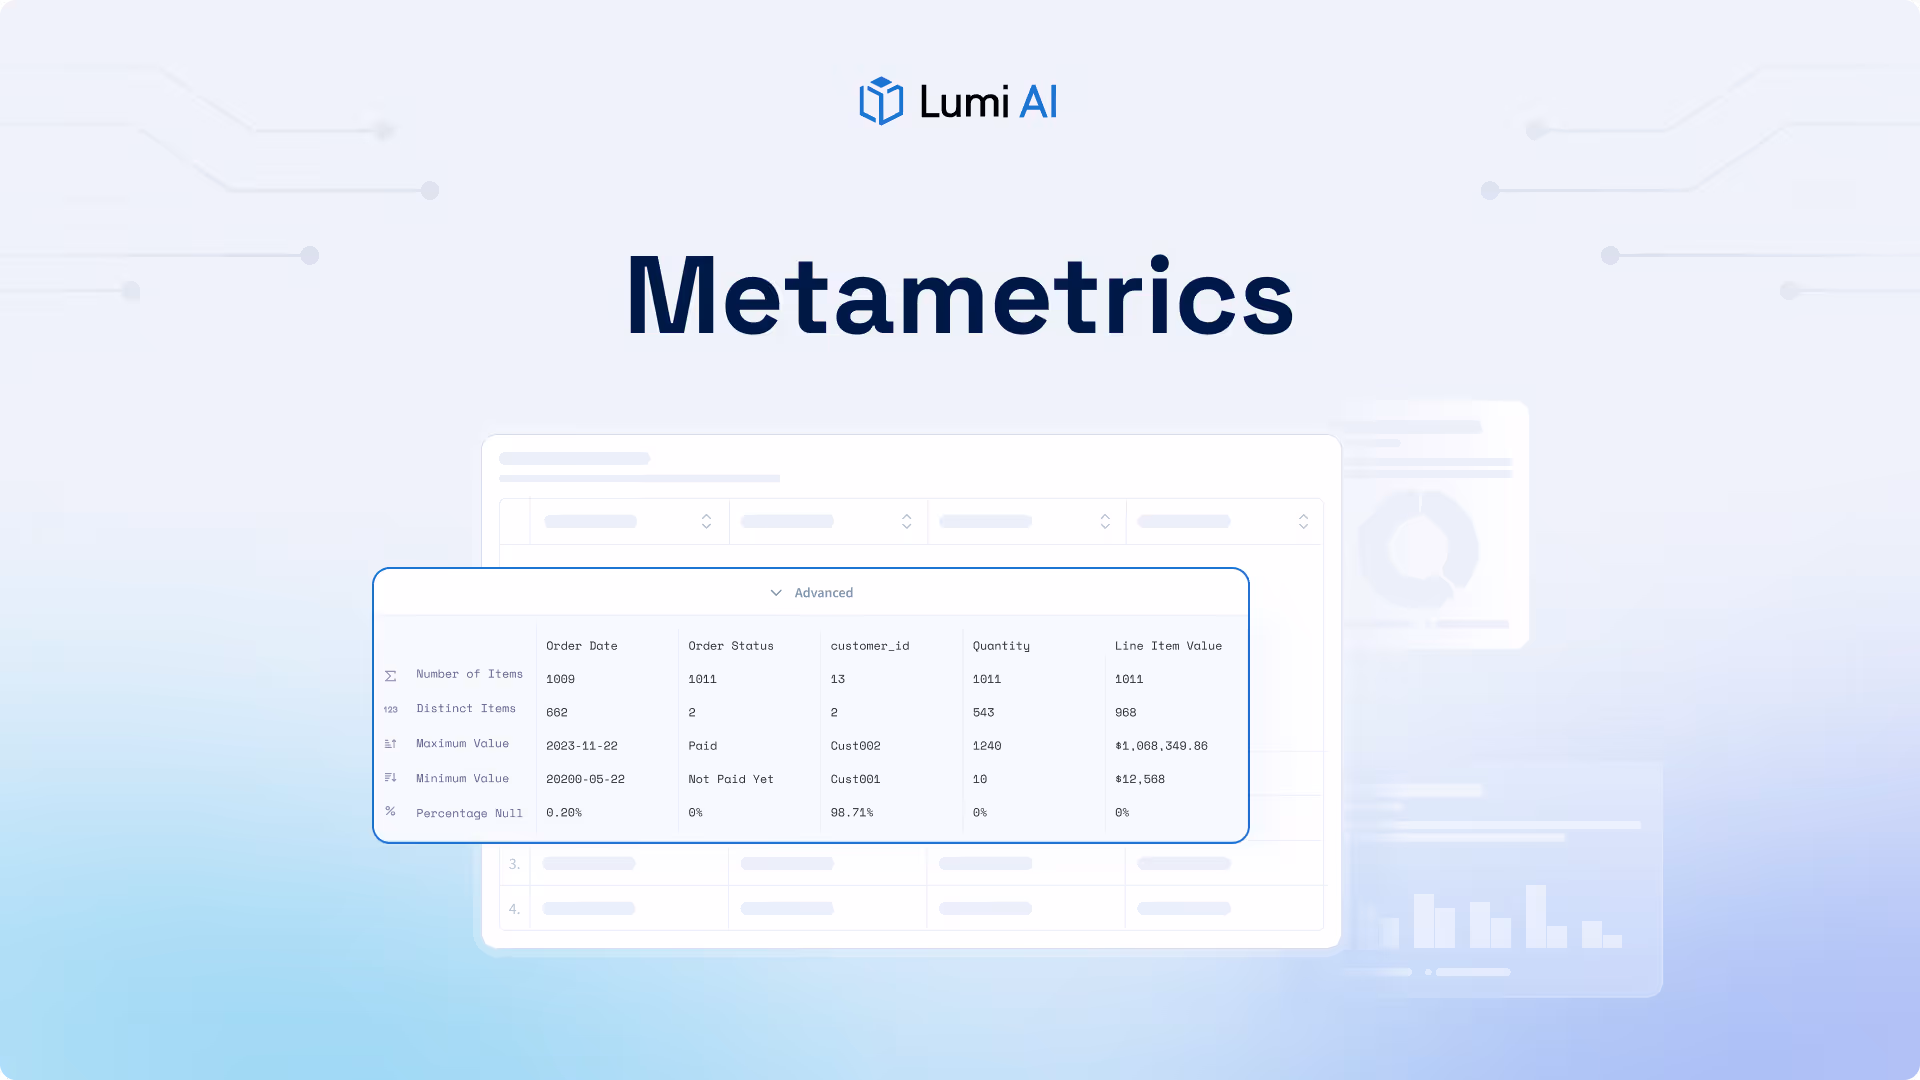
At Lumi, we’re excited to introduce our latest feature release Metametrics. Built to make data exploration faster and more transparent, Metametrics automatically surfaces column-level insights so analysts can understand their data at a glance.
What’s New?
Instant Data Summaries: Metametrics provides an immediate overview of every data table you connect, summarizing key metrics such as:
- Number of records
- Number of distinct values
- Minimum and maximum values
- Percentage of nulls
This quick snapshot allows analysts to spot inconsistencies, missing data, or unusual distributions without writing a single query.
Feature Highlights
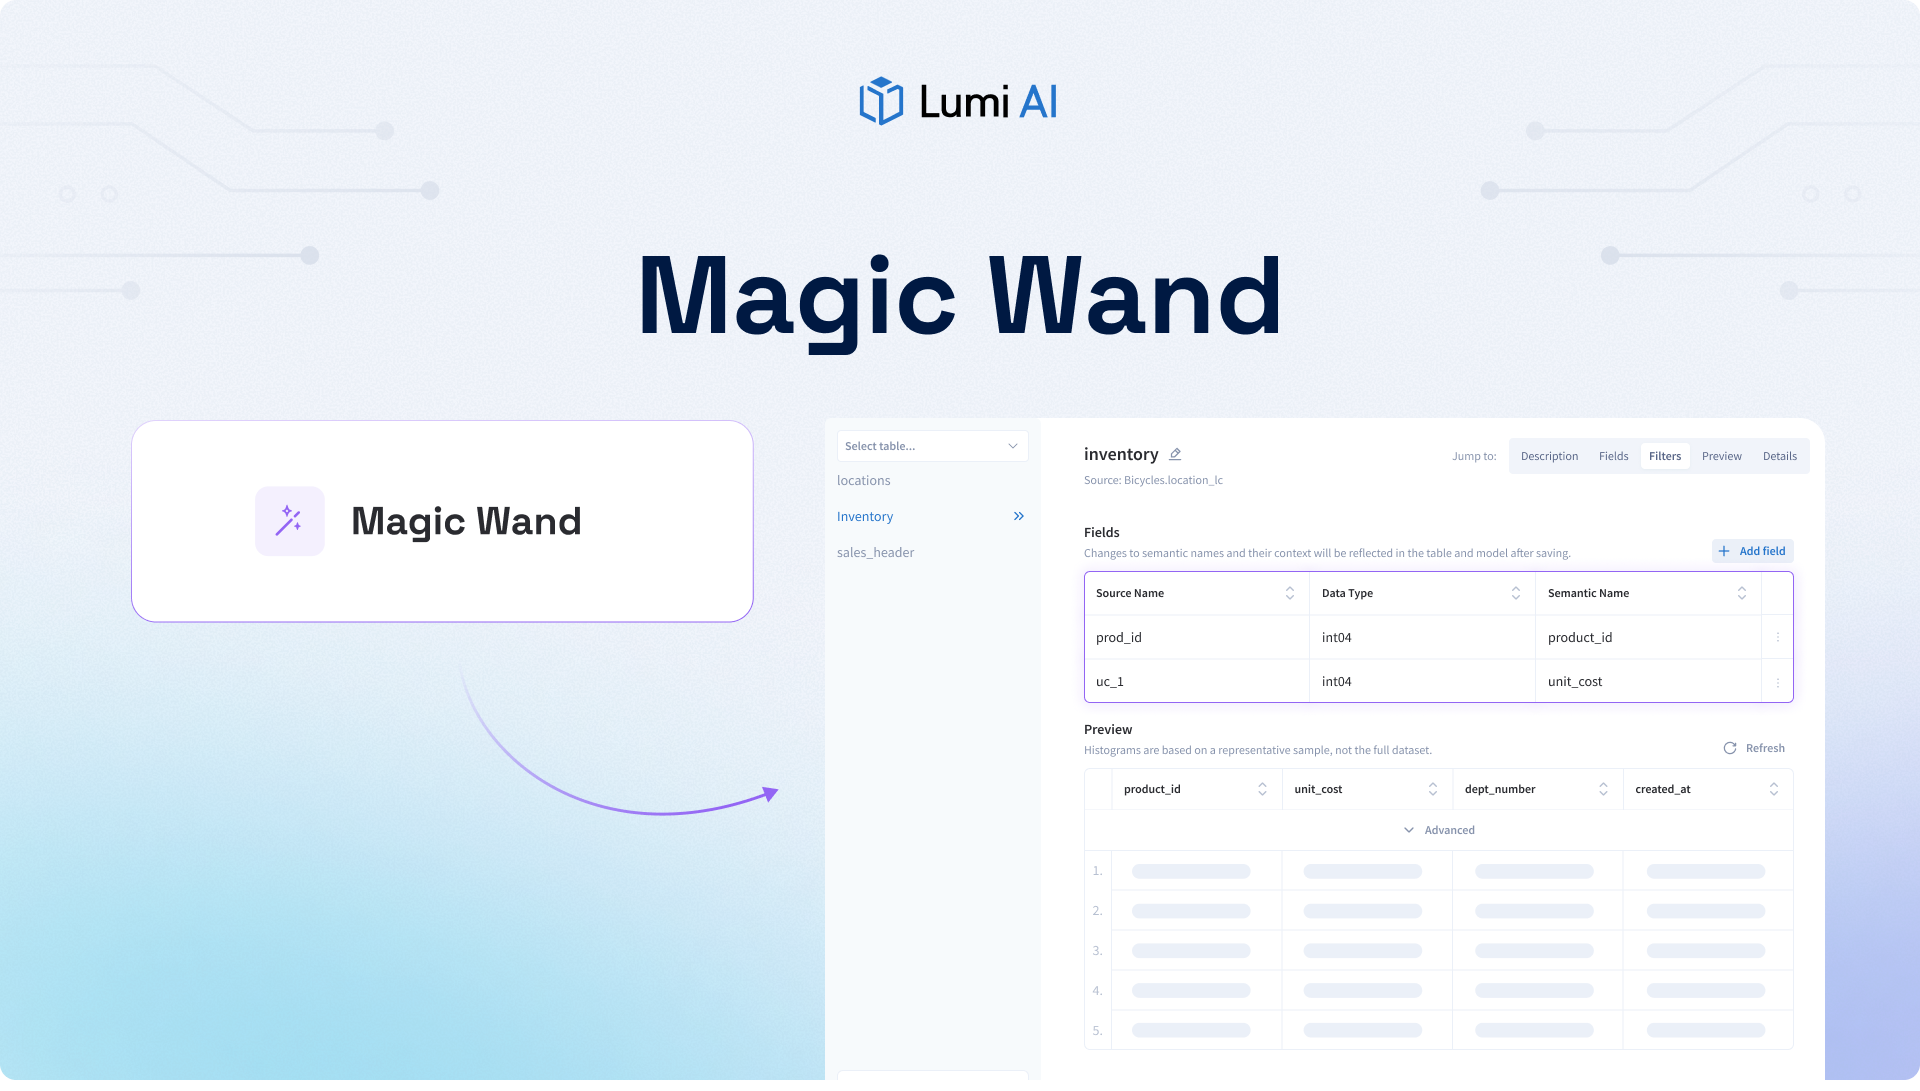
Deeper Context for Query Generation
Metametrics automatically computes and feeds column-level statistics directly into Lumi’s analytics agents. This gives the agents generate more accurate, high-quality SQL queries.
By knowing metrics like the number of distinct values, minimum and maximum values, and null percentages, Lumi’s agents can reason more accurately about how to structure queries. They can also access sample field values, which provide additional context about what the data actually contains (for example, what a product category or region names looks like).
Understand Your Data at a Glance
These summaries help analysts quickly evaluate the structure and health of their data without running validation queries or manual checks. By presenting a concise overview of column-level patterns, Metametrics helps analysts and data teams identify:
- Categorical patterns: can be identified with columns that have limited unique values serving as flags or containing category types.
- Range boundaries: minimum and maximum values can be used to reveal usable timeframes or detect illogical values.
- Completeness indicators: high percentages of nulls highlight potential risks when filtering or aggregating data.
Metametrics is another step in Lumi’s mission to make enterprise analytics seamless and intelligent, empowering every user to understand their data instantly, explore with confidence, and uncover insights faster than ever.

Make Better, Faster Decisions.
Join Our Newsletter
Subscribe for the latest on self-service analytics, AI, and data-driven transformations.


