
Analytics Glossary
Self-Service Analytics: 5 Best Tools in 2025
.avif)
In the past decade, enterprise analytics has primarily run on traditional Business Intelligence (BI) models: centralied data teams, IT-led reporting pipelines and lengthy cycles from request to insight. But as data volumes swell and business environments accelerate, that model is straining. The global self-service analytics market is projected to grow from US$4.82 billion in 2024 to about US$17.52 billion by 2033, a compound annual growth rate of roughly 15.9% which signals a fundamental shift in how organizations consume analytics.
As a result, many organizations are shifting responsibility for insight generation away from specialized analytics teams and empowering business users directly with self-service tools. Research by Gartner found that 49% of executives regard self-service data and analytics as a driver of employee productivity, with a significant share also citing increased organisational speed and agility. This democratization of analytics means that marketing, operations and sales functions can act on data independently, reducing bottlenecks, improving responsiveness, and enabling the analytics team to focus on higher-value strategic work.
Self-service analytics has evolved far beyond simple dashboards into platforms infused with generative AI, natural language querying and automation layers. In this article, we will discuss precisely what self-service analytics entails, explore its business impact, compare the best-in-class tools, and show how Lumi AI differentiates itself by delivering intuitive self-service capabilities that let non-technical users access trusted, enterprise-grade analytics at speed.
What is Self-Service Analytics?
Self-service analytics is the modern approach to business intelligence that lets people across an organization access, explore, and analyze data without waiting for IT or data specialists. Instead of routing every request through a centralized team, business users can connect to curated datasets, build their own visualizations, and uncover insights independently. This model reduces dependency on technical gatekeepers and shortens the time between a question and an actionable answer.
At its core, self-service analytics rests on three principles: accessibility, governance, and scalability. Accessibility ensures that data tools are intuitive enough for non-technical users while still powerful enough to handle complex queries. Governance provides the foundation of trust, maintaining consistent definitions, secure permissions, and so that data insights are reliable and verifiable. Finally, a system that is scalable ensures that as the business grows and data volumes multiply, performance and collaboration do not suffer.
Self-service analytics is used by professionals who depend on fast, context-rich insights but may not have coding or technical expertise. Business analysts, operations managers, and exectuitve leadership all rely on these systems to track performance, diagnose anomalies, and validate decisions in real time.
Benefits of Self-Service Analytics
- Empower non-technical users: Self-service analytics removes the technical barrier between business users and the data they rely on. By offering intuitive interfaces, user generated dashboards, and natural language querying, it enables employees in marketing, finance, operations, and other departments to explore information independently. This empowerment shifts analytics from being an IT function to a shared capability and lets non-technical users validate assumptions, uncover opportunities, and contribute insights without waiting for specialized analysts.
- Accelerate decision-making: With direct access to real-time data, teams can move from reactive reporting to proactive, insight-led action. Instead of waiting days or weeks for reports, business users can instantly visualize performance metrics, test hypotheses, and make course corrections. Faster decisions translate to greater agility, especially in fast-moving industries where timely action determines competitive advantage.
- Reduce data bottlenecks: In traditional BI environments, every new report or dashboard request passes through IT or data engineering, creating long queues and overburdened teams. Self-service analytics decentralizes that model by enabling governed access to data sources through standardized tools and templates. IT still maintains control over data integrity and security, but day-to-day reporting shifts to business teams. The result is a leaner analytics pipeline, reduced backlog, and better resource allocation across both technical and functional units.
- Foster a data-driven culture: When insights are no longer confined to a few specialists, data becomes part of every conversation. Self-service analytics fosters collaboration across departments, encouraging employees to question assumptions and back decisions with evidence. Over time, this accessibility cultivates a data-driven mindset, where performance metrics, forecasts, and customer trends are used to guide every strategic move.
Core Features That Enable Effective Self-Service Analytics
Here are five key elements that every self-service analytics platform must deliver:
- Plain-language interaction: A self-service analytics tool should allow users to ask questions in everyday business language, not SQL or code. This removes technical barriers so insights are accessible to anyone who understands the business problem.
- Governed access with shared definitions: Teams must be able to explore data freely while still relying on consistent KPI definitions and permission controls. Governance ensures insights are trusted, compliant, and aligned across departments.
- Automated insight guidance: Beyond showing dashboards, the platform should help users identify trends, anomalies, and drivers that were otherwise inaccessable to users without technical skill.
- Integration flexibility across data sources: Businesses don't all use the same data source system, so it is critical that the tool can be source system agnostic and be easy to integrate with to reduce IT dependency and technical roadblocks.
- Scalable performance for enterprise-wide usage: As more users explore more data, the tool must maintain speed and reliability across large data sets at various levels of aggregation. True scalability means insights remain fast and dependable even as data volumes and workflows expand.
Here are five of the best tools to use for your self-service analytics needs.
5 Best Self-Service Analytics Tools
1. Lumi AI
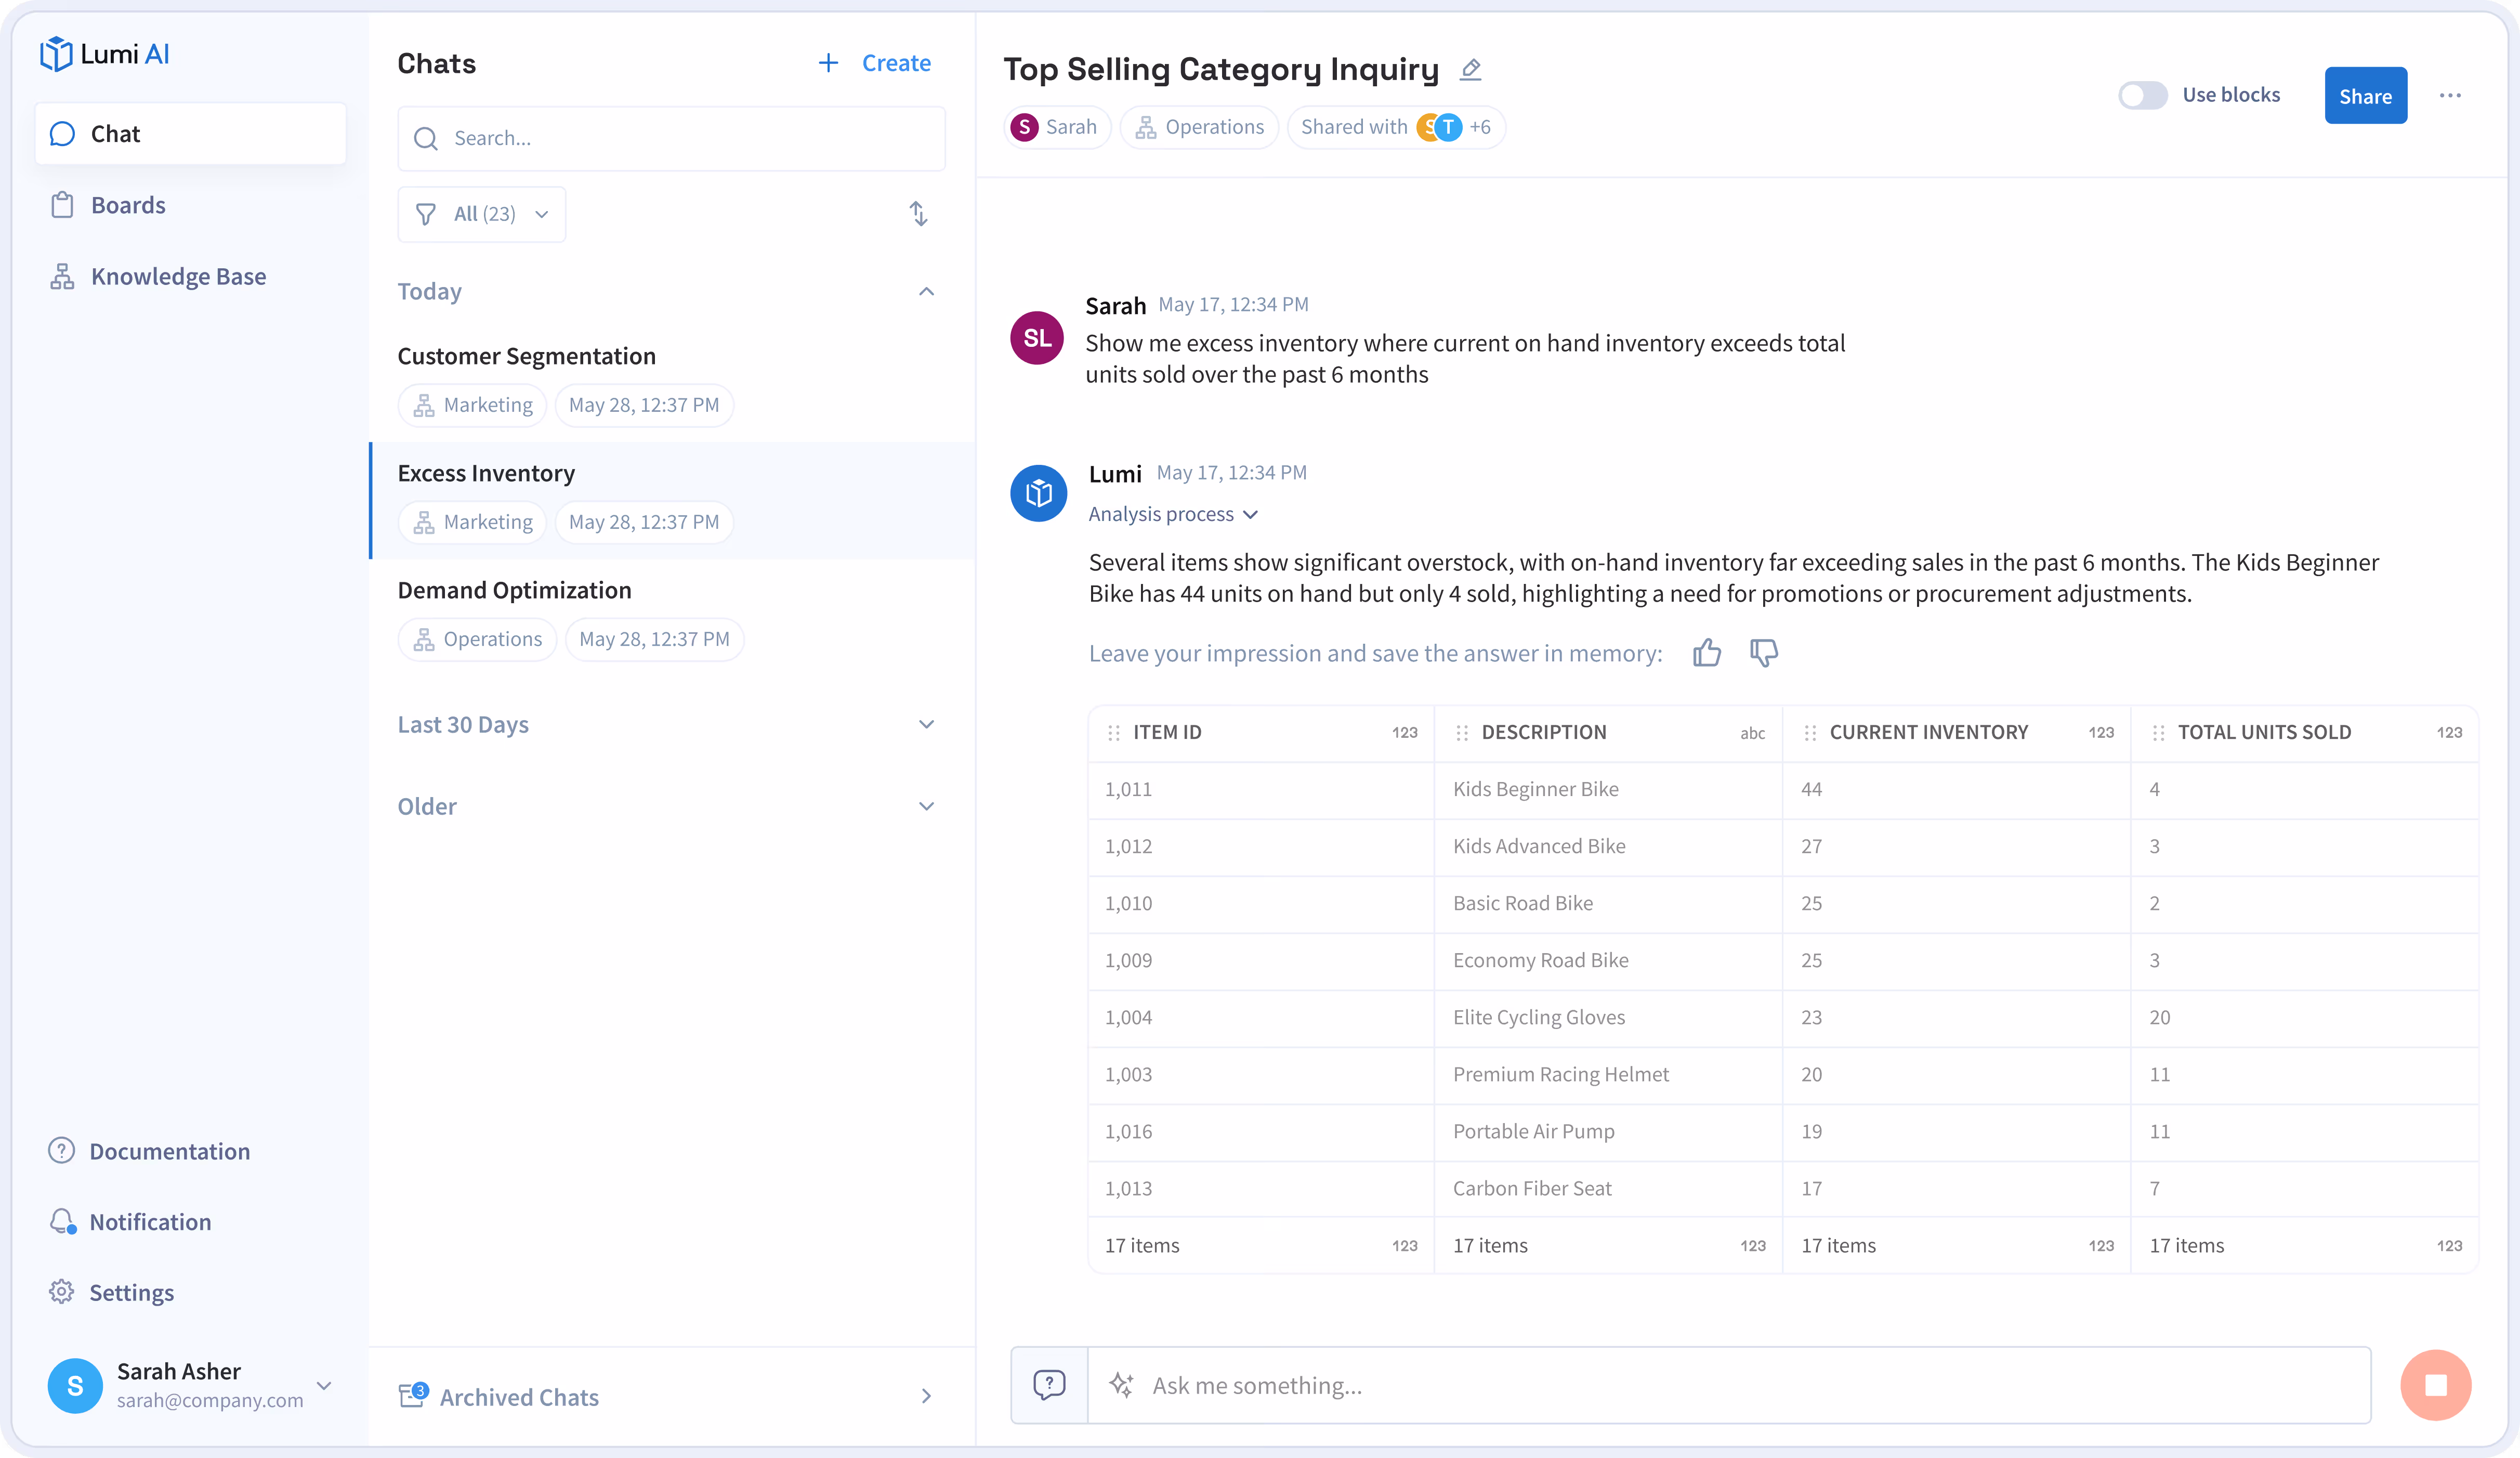
Lumi AI is an advanced analytics platform that combines natural language querying, automated data exploration, and AI-driven insight generation to make complex analysis accessible to everyone. It enables users to interact with their data conversationally, transforming plain-language questions into precise SQL queries, dashboards, and actionable insights. Designed for both technical and non-technical teams, Lumi streamlines analytics workflows, accelerates decision-making, and ensures trust through human verification and transparent AI processes.
What truly sets Lumi AI apart is its multi-agent architecture and innovative knowledge base approach which enables conversational querying, context-aware follow-ups, and visibility into collaborative agent actions.
Another identifing feature is Lumi’s Human Verification module, which integrates human oversight into AI-generated insights. This ensures that every recommendation or output can be reviewed, validated, and approved, maintaining transparency and accountability across workflows.
Lumi delivers analytics that are not only fast and accurate but also explainable and trustworthy, bridging the gap between automation and human expertise.
Best features of Lumi AI
“ Lumi has allowed me to quickly build custom reports and extend their scope with AI-generated insights, without needing SQL knowledge or detailed data management expertise, making it easy for even low-tech proficiency users to create actionable, business-contextual reports.

Nick D. Vice President of Operations
- Natural-language querying: Lumi AI enables users to ask questions in plain English (or their business language) and get insights without needing to write SQL or Python.
- Business-context knowledge base: It lets you define your own KPI names, internal metrics, and business terminology so the tool “speaks your business language” rather than forcing you into generic analytics terms.
- Instant visualizations and dashboards: After insights are generated, Lumi supports the creation of interactive visuals and dashboards that business users can explore and share.
- Enterprise-grade security & governance: It offers features like advanced user permissions, working within your network (raw data doesn’t need to leave your environment).
- Pre-built connectors & seamless integrations: Lumi AI comes with an extensive library of out-of-the-box integrations to major systems like Snowflake, Google BigQuery, SAP S/4HANA, Oracle, Microsoft Dynamics 365 and more.
- Data model configuration: Lumi provides tools to configure your data model (renaming fields, defining relationships) for self-service analytics.
Limitations of Lumi AI
- Adapting to a new way of interacting with data: While Lumi is designed for natural language interaction, users may need a brief adjustment period to learn how to phrase more complex analytical prompts effectively.
- Adoption depends on change management: Introducing AI-driven analytics means teams must shift habits from manual processes to automated workflows, which can slow early adoption if proper enablement isn’t in place.
- Visualization Customization : Custom dashboard designs and advanced visualizations may be limited compared to full BI tools; Lumi prioritizes conversational speed over heavy visualization capabilities.
Lumi AI Pricing
View more info on Lumi's pricing page:
- Standard: $50/user/month
- Pro: $75/user/month + platform fee
- Enterprise: Contact company for custom pricing
2. Tableau
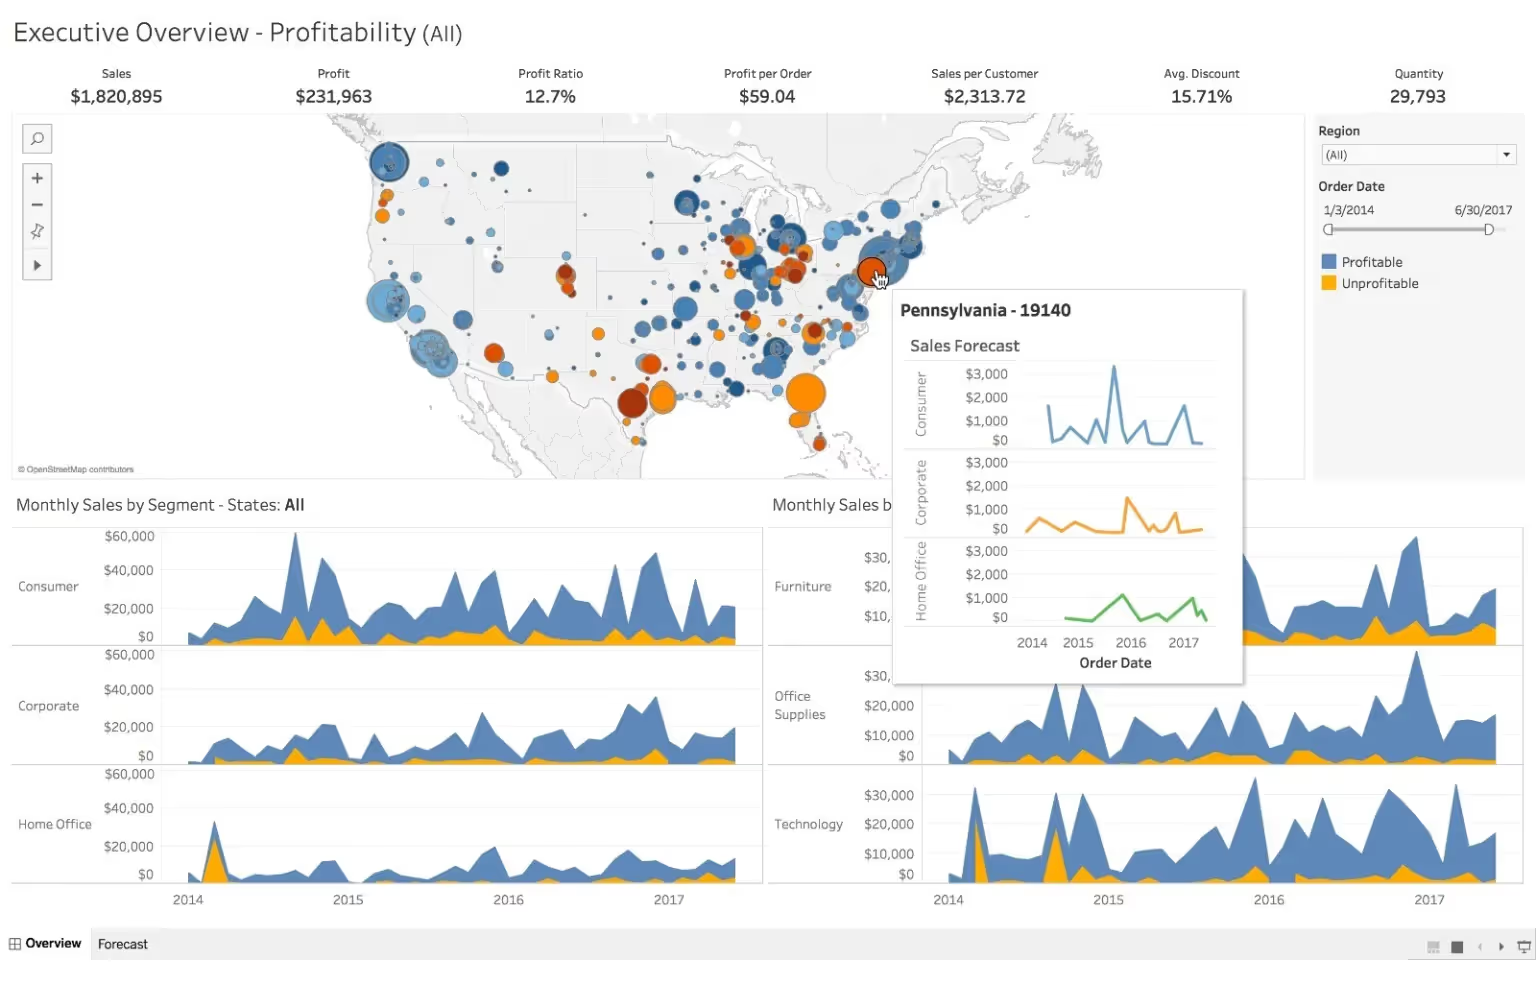
Tableau is one of the most established platforms in modern business intelligence, known for its visual-first approach to data analysis. It allows users to transform complex datasets into interactive dashboards and visual stories, making insights easier to interpret and share across teams. With its combination of drag-and-drop simplicity and deep analytical power, Tableau serves both non-technical users seeking quick overviews and advanced analysts building sophisticated data models.
Best features of Tableau
- Ease of use: Tableau’s drag-and-drop interface allows data analysts to explore and visualize data quickly without needing technical expertise
- Data visualization: It excels at transforming complex datasets into interactive, visually rich dashboards that make patterns and trends easy to interpret
- Features: Tableau combines advanced analytics, real-time collaboration, and broad integration options to support diverse enterprise data needs
- Intuitive design: Its clean, visual workspace mirrors natural analytical thinking, making it simple for users to move from exploration to insight seamlessly
Limitations of Tableau
- Slow performance: Users handling large or granular datasets sometimes report slower performance, especially when multiple data sources are joined or visualizations become highly detailed.
- Priciness: Its pricing structure is on the higher side, making it less accessible for small businesses or teams with limited budgets
- Complex calculations: Creating advanced calculated fields or table calculations can be unintuitive for non-technical users.
- Static Dashboards: Once a visualization is created by authorized users, these dashboards and reports are static meaning you can’t change them or drill down, this limits exploration.
Tableau pricing
Tableau Standard Edition pricing:
- Tableau Public: Free version
- Tableau Viewer: $15/user/month
- Tableau Explorer: $42/user/month
- Tableau Creator: $75/user/month
Tableau Enterprise Edition pricing:
- Tableau Enterprise Viewer: $35/user/month
- Tableau Enterprise Explorer: $70/user/month
- Tableau Enterprise Creator: $115/user/month
Tableau ratings and reviews
3. Microsoft Power BI
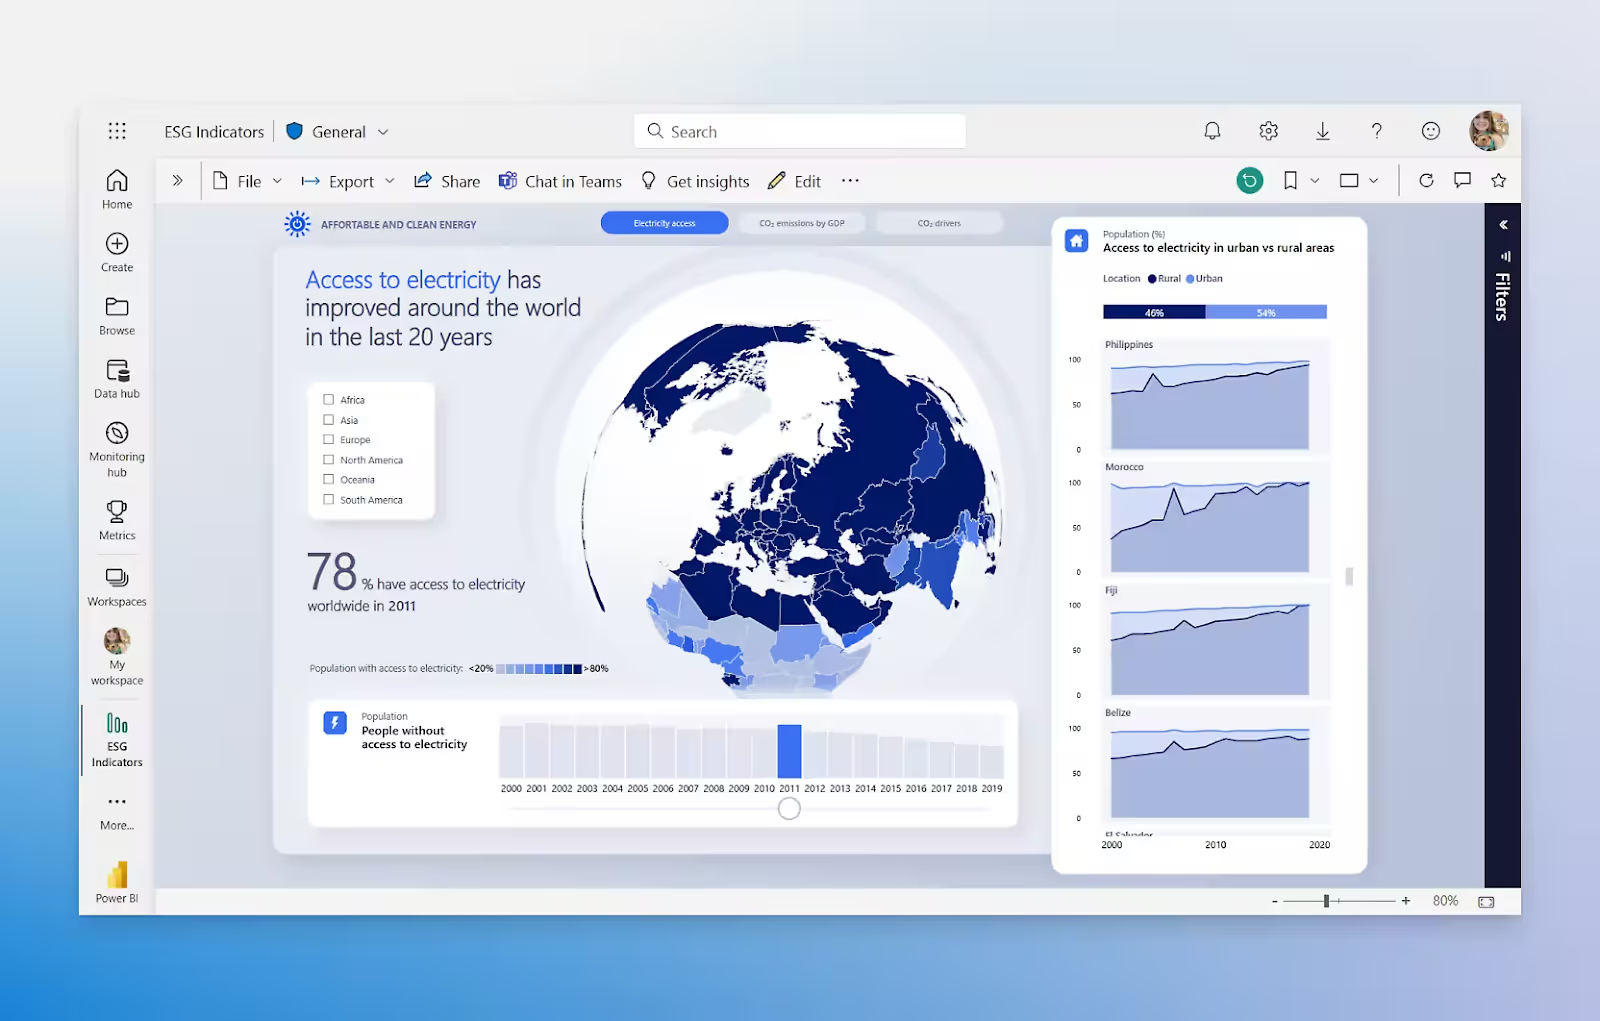
Microsoft Power BI is a comprehensive business intelligence platform that integrates seamlessly with the Microsoft ecosystem, making it a natural choice for organizations already using Excel, Azure, or Office 365. It enables users to connect, transform, and visualize data from diverse sources through an intuitive interface that supports both self-service exploration and enterprise-scale reporting. Designed for accessibility and collaboration, Power BI empowers business users to build dashboards, share insights, and make data-driven decisions in real time.
Best features of Microsoft Power BI
- Ease of use: Power BI’s interface is user-friendly and familiar to anyone who has worked with Excel, allowing quick adoption even among non-technical users
- Data visualization: Its visualization capabilities are highly flexible, offering rich, interactive dashboards and customizable reports suited for both overview and deep-dive analysis
- Integrations: The platform integrates seamlessly with other Microsoft products, such as Excel, Azure, and Teams, as well as a wide range of third-party data sources, streamlining workflows across systems
- Powerful BI: It delivers robust business intelligence functions, combining data modeling, AI-driven insights, and real-time reporting to support enterprise-level analytics and strategic decision-making
Limitations of Microsoft Power BI
- Data size limits: Power BI Pro restricts datasets to 1 GB; even in Premium, large data models require memory and capacity management.
- Complex setup for non-Microsoft environments: Integration is seamless within Azure and Microsoft ecosystems but less straightforward for other stacks.
- Learning curve for DAX: Advanced analytics require understanding DAX (Data Analysis Expressions to create calculated columns, measures, and KPIs) which can be difficult for users.
Microsoft Power BI pricing
- Free account
- Power BI Pro: $14/user/month
- Power BI Premium: $24/user/month
- Power BI Embedded: Contact company for pricing
Microsoft Power BI ratings and reviews
4. Looker
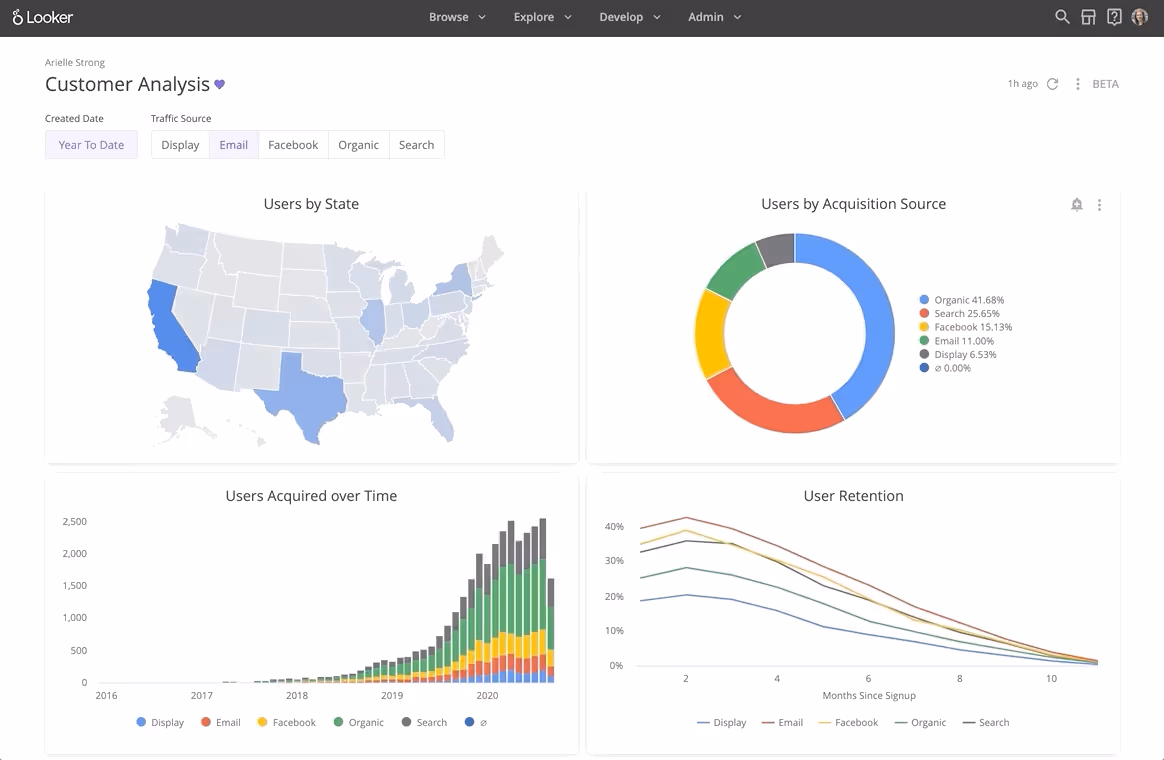
Looker is a modern business-intelligence and analytics platform built on a semantic modeling layer that delivers governed, live-connected data exploration across cloud data warehouses. It empowers both business users and data teams to define a single version of truth via its modeling language LookML, enabling consistent metrics and self-service analytics at scale. With tight integration into the Google Cloud ecosystem and support for embedding analytics into applications, Looker supports operational workflows as well as dashboards and ad-hoc analysis.
Best features of Looker
- Ease of use: The platform’s interface is widely cited as intuitive, enabling users to build dashboards and reports with minimal training
- Data visualization: It supports robust data visualization capabilities, offering drag-and-drop charts and interactive dashboards that help convert raw data into actionable insights
- Easy integrations: Looker integrates smoothly with a wide range of data sources, including cloud warehouses and Google ecosystem tools, making it easier for organizations to consolidate analytics workflows
- Insights: Users also highlight its strong insight generation features, such as built-in drill-down and exploration tools that let business users dig into trends without extensive SQL knowledge
Limitations of Looker
- Poor visualization: While functional, its visualization options are often seen as less flexible and polished compared to competitors like Tableau or Power BI
- LookML dependency: Every metric or view must be modeled in LookML, requiring technical expertise and developer involvement.
- Limited self-service flexibility: Business users can explore existing models but can’t easily create new metrics without developer help.
Looker pricing
Contact company for pricing
Looker ratings and reviews
5. Sisense
Sisense is a business intelligence and analytics platform designed to simplify complex data preparation and deliver embedded, interactive insights at scale. It is known for its end-to-end architecture, allowing users to connect, transform, analyze, and visualize data within a single environment. Often used in product and operational analytics, Sisense enables organizations to integrate dashboards and insights directly into customer-facing applications and workflows.
Best features of Sisense
- Ease of use: Many users find Sisense relatively easy to work with, especially for building dashboards and handling data without extensive coding
- Data visualization: It offers strong data visualization capabilities that help teams turn complex datasets into clear, interactive insights
- Integrations: Sisense supports flexible integrations with cloud warehouses, databases, and applications, making it suitable for embedded and cross-platform analytics use cases
- Customer support: Its customer support is frequently praised for being responsive and helpful, particularly during deployment and troubleshooting
Limitations of Sisense
- Missing features: Some users mention that certain expected BI capabilities or customization options are limited or still evolving
- Bugs: Occasional bugs and stability issues are reported, particularly when handling large-scale environments or frequent feature updates
Sisense pricing
Users have claimed to pay between:
- $50,000 for 50 users (with no cloud hosting) and
- $75,000 for 50 users (with cloud hosting)
Sisense ratings and reviews
Challenges of Self-Service Analytics
Data quality and governance concerns
Self-service analytics often expands access to data faster than organizations can govern it, leading to mismatched reports, conflicting KPIs, and unverified insights spreading across teams. Without strong data foundations, users may make decisions based on incomplete or inaccurate information, undermining trust and slowing adoption of analytics as a whole.
To address this, enterprises need clear governance frameworks that define where data comes from, how metrics are calculated, and who has permission to view or edit each dataset. Automated data validation, consistent semantic layers, and transparent change tracking help ensure that self-service doesn’t compromise reliability.
Lack of standardization
As more business users begin running their own analyses, it’s common for parallel versions of reports to emerge, each using different assumptions or KPI definitions. This “shadow analytics” environment breeds confusion and debate over whose numbers are correct rather than alignment on what the numbers mean.
Countering this requires tools that bring freedom and control together: centralized metric definitions, standardized dashboards, and the ability to reuse shared data models across teams. Encouraging collaboration within the same analytics environment (instead of exporting spreadsheets offline) preserves consistency and enables insights to scale without fragmentation.
Integration with existing BI tools and workflows
Organizations rarely start analytics from scratch as they already rely on legacy BI systems, data warehouses, and operational software that hold critical data. When self-service analytics platforms don’t integrate natively with this ecosystem, IT teams become bottlenecks again, defeating the purpose of “self-service.”
Successful adoption means selecting platforms with wide connector libraries, APIs, and the ability to extend or embed insights into existing workflows. Aligning self-service solutions with current architecture allows business users to gain flexibility while IT maintains oversight and system performance.
How Lumi AI Elevates Self-Service Analytics
Lumi AI embodies the evolution of self-service analytics with a natural language interface that eliminates the need for SQL or Python, allowing anyone to query data using the terminology they use every day. Its unified data exploration ensures every department works from the same governed definitions and shared KPIs, reducing the risk of conflicting dashboards or fragmented interpretations. With transparent workflows and human-in-the-loop verification, Lumi maintains data accuracy and accountability even as access scales across the enterprise.
Unlike legacy BI tools that rely on multiple steps to transform questions into answers, Lumi automates exploration and visualization as soon as the data is connected. Ready to move beyond dashboards? Book a Lumi AI demo today!

Maria is a data analyst turned content writer with a strong foundation in data analytics. With her unique blend of technical expertise and creative flair, she specializes in transforming complex concepts into engaging, accessible content that resonates with both technical and non-technical audiences.
.avif)

The New Standard for Analytics is Agentic
Make Better, Faster Decisions.

