
Analytics Glossary
Exploratory Data Analysis
.avif)
Exploratory Data Analysis (EDA): Essential Guide
In large analytics efforts, raw data typically contains gaps, misalignments, hidden biases, and structural quirks that cannot be ignored. A Forbes analysis reported that roughly 85% of AI initiatives fail to deliver promised value and identified data and data preparation shortfalls as primary drivers. Surveys and industry reports likewise show that a large fraction of time is consumed by data prep; for example, Anaconda’s State of Data Science reports list data preparation and cleaning as a top pain point for practitioners.
Exploratory Data Analysis, or EDA is used to detect patterns of missing data, outliers, expose inconsistent categories, characterise skewed distributions, and surface correlations that vary across segments.
In enterprises such as retail, consumer packaged goods, and supply chain operations, EDA produces direct financial and operational impact. A supply chain analytics case study documents a 12% reduction in stockouts and a 15% decline in excess inventory after deploying deeper diagnostics and real-time visibility. A separate retail logistics case study reports a roughly 33% cut in logistics costs that translated to about €3.5 million in annual savings for the client after SKU prioritization and shipment optimization. In the sections that follow, we’ll break down what exploratory data analysis involves, its purpose, process, and methods, along with the obstacles analysts often face when exploring complex datasets. We’ll also look at how artificial intelligence is reshaping this foundational stage, turning what used to be a manual, time-intensive task into a more intelligent and collaborative exercise. With AI-driven tools such as Lumi, EDA can now uncover insights faster and help teams move from raw data to reliable understanding with far greater efficiency.
What is Exploratory Data Analysis?
Exploratory Data Analysis (EDA) is the process of examining, summarizing, and visualizing datasets to understand their main characteristics before formal modeling begins. It helps analysts get a clear sense of the data’s structure, detect potential errors or anomalies, and uncover relationships that may guide the next analytical steps.
The core goals of EDA are to summarize key variables, identify trends or patterns, discover any data quality issues, and test assumptions that could affect downstream analysis. Within modern data science workflows, it serves as the quality and insight checkpoint, ensuring data integrity, revealing early hypotheses, and preventing flawed modeling decisions.
EDA also bridges raw data and predictive modeling. By exposing hidden structures and validating distributions, it shapes feature selection, model choice, and parameter tuning. Analysts often use tools and libraries such as pandas, seaborn, Tableau, and Lumi AI to perform this phase efficiently, combining statistical exploration with intuitive visualization.
Core Objectives of Exploratory Data Analysis

Uncover patterns, relationships, and anomalies
One of the main objectives of Exploratory Data Analysis is to surface meaningful patterns that would otherwise remain hidden in raw data. By visualizing and summarizing variables, analysts can detect relationships, such as how product demand fluctuates by season, geography, or channel, and spot irregularities that may distort conclusions.
In supply chain and 3PL contexts, EDA might reveal that delivery delays consistently cluster around specific regions or carriers, suggesting process bottlenecks or logistical inefficiencies. Similarly, retail and CPG analysts often use EDA to identify purchasing correlations across product categories, like how a spike in snack sales follows beverage promotions, or to flag anomalies such as sudden drops in transaction volume that may indicate data capture issues or system faults.
Validate assumptions before modeling
Another core goal of EDA is to verify that the data meets the assumptions required for statistical or machine learning models. Analysts test for normality, linearity, independence, and equal variance to ensure that patterns found are genuine and not artifacts of data bias or structure.
In a supply chain dataset, for example, EDA may reveal that lead times are not normally distributed but skewed by specific suppliers, information that shapes model selection and preprocessing steps. In retail or CPG settings, checking assumptions might expose multicollinearity between price and promotion variables or seasonal autocorrelation in sales data, prompting adjustments before any forecasting or optimization models are trained.
Guide feature selection and engineering
EDA helps identify which variables truly drive outcomes and how they can be transformed to improve model performance. By examining correlations, distributions, and variable importance, analysts can determine which features add predictive value and which introduce noise. In supply chain analytics, for instance, EDA might highlight that supplier reliability and order volume variability are stronger predictors of stockouts than average delivery time. In retail or CPG data, it can reveal that recency and frequency of purchase outperform demographic variables when predicting customer churn.
Improve business understanding of operational data
EDA transforms raw numbers into a clear narrative about how a business operates. By summarizing metrics, visualizing trends, and exposing inefficiencies or dependencies, it helps teams move beyond intuition to evidence-based understanding. In supply chain settings, this could mean uncovering where delays or excess costs originate; in retail or CPG, it might highlight which products or stores drive profitability and which underperform.
The Exploratory Data Analysis Workflow
Data collection & cleaning
The first step in exploratory data analysis is gathering all relevant data and preparing it for analysis by addressing quality issues such as missing values, duplicates, and outliers. Analysts consolidate inputs from multiple systems, like ERP, CRM, or transaction logs, and ensure consistency across formats, timestamps, and measurement units. Techniques such as imputation, interpolation, or trimming are applied to handle incomplete or extreme values without distorting the dataset. This stage ensures that subsequent exploration is based on reliable, standardized information, preventing misleading insights and model errors later in the workflow.
Initial profiling
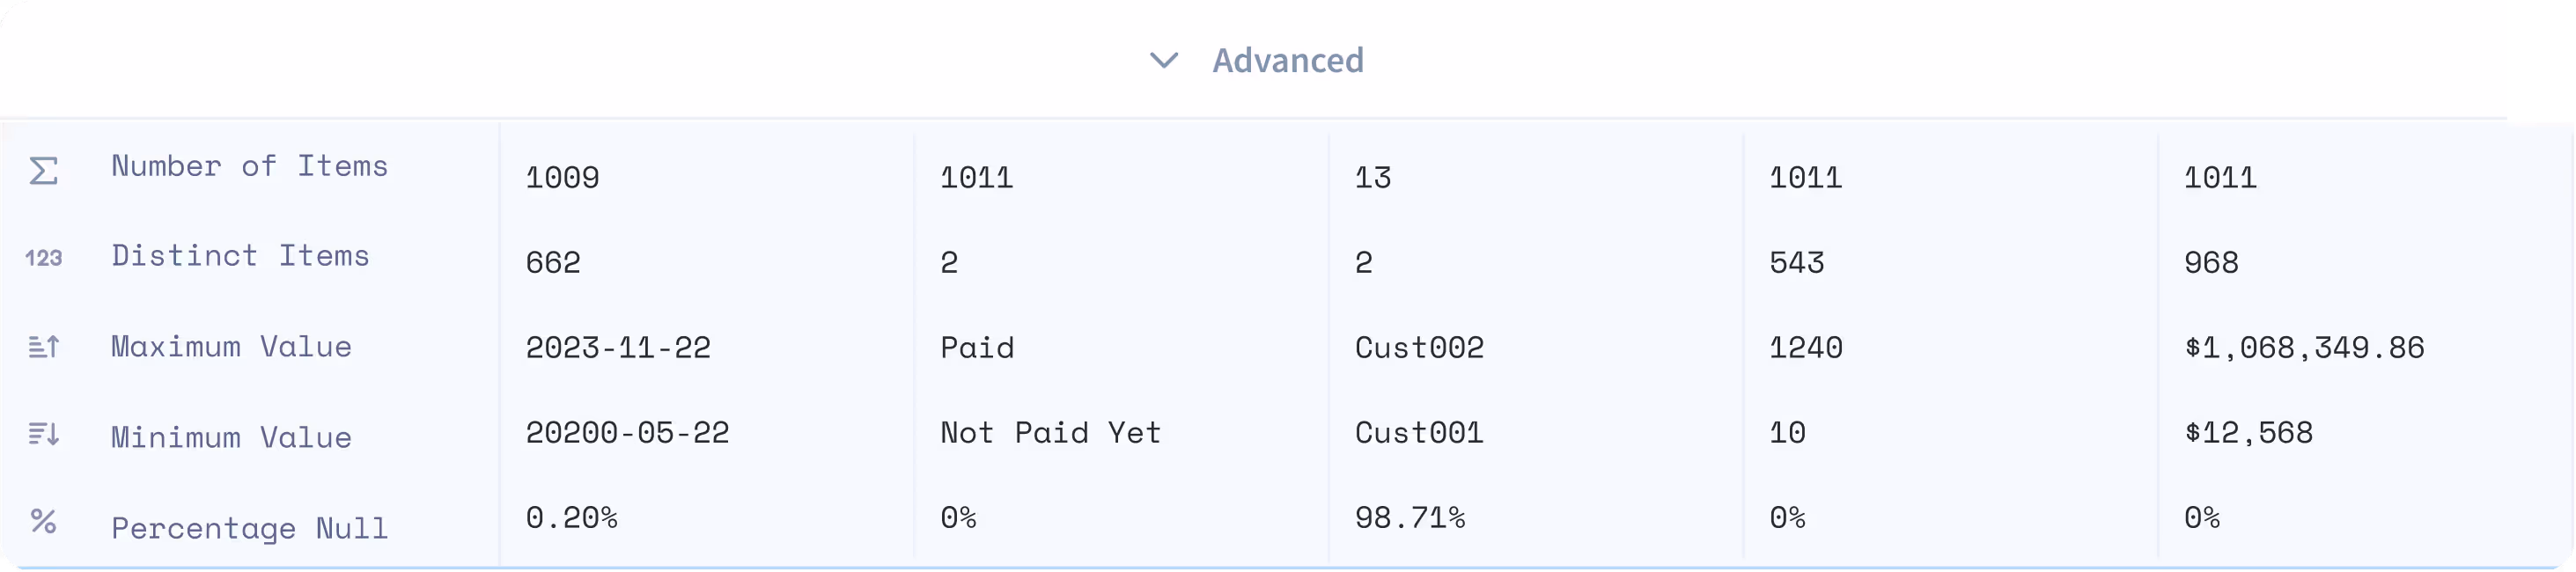
Once the data is cleaned, analysts perform an initial scan to understand its structure and composition. This involves generating summary statistics, such as mean, median, standard deviation, and range, then visualizing distributions to spot skewness, imbalance, or unusual spread. Profiling also includes examining categorical frequency counts, data types, and unique identifiers to verify completeness and consistency. By quickly assessing central tendencies and variability, analysts gain a foundational view of how each variable behaves, guiding where to probe deeper in the next stages of EDA.
Visual exploration
At this stage, analysts translate data into visuals to uncover relationships and structural patterns that numbers alone can’t reveal. Techniques such as histograms, box plots, scatter plots, and pairplots help highlight variable distributions, clusters, and outliers, while heatmaps and correlation matrices expose interdependencies across metrics. Visual exploration clarifies whether relationships appear linear or nonlinear, and whether certain variables move together in meaningful ways. These visual cues often surface early insights, like emerging demand trends or operational bottlenecks, that guide deeper statistical testing or feature refinement.
Hypothesis generation
After visualizing and profiling the data, analysts begin forming hypotheses to explain observed patterns and anomalies. This stage moves exploration from description to reasoning, asking questions such as “why” certain correlations exist, “what” factors drive fluctuations, or “how” different variables interact over time. Analysts might suspect that rising order delays align with supplier congestion or that a sales dip coincides with reduced promotions. These hypotheses are then tested through segmentation, controlled comparisons, or statistical validation, transforming visual observations into structured insights that guide modeling and decision-making.
Feature transformation
Feature transformation refines the dataset to make variables more suitable for modeling and interpretation. Analysts apply techniques like log scaling to reduce skewness, normalization or standardization to align variable ranges, and encoding to convert categorical values into numeric form. This step also includes deriving new metrics, such as ratios, time lags, or moving averages, that capture underlying business behaviour more effectively. Proper transformation ensures that no single feature dominates due to scale or distribution, leading to more stable analyses and model performance in subsequent stages
Iterate & document insights
EDA is an iterative process where each discovery prompts further questioning and refinement. Analysts loop back through cleaning, visualization, and hypothesis steps as new insights emerge, ensuring that no critical detail is overlooked. Just as importantly, they document every observation, assumption, and decision, from how missing data was handled to why certain features were transformed. This documentation creates transparency, enabling teams to replicate findings, justify modeling choices, and maintain a clear lineage of analytical reasoning throughout the project lifecycle.
Techniques and Tools of Exploratory Data Analysis

Descriptive statistics
Descriptive statistics summarize the main characteristics of a dataset, providing a quantitative snapshot before deeper analysis begins. Measures like mean and median describe central tendency, while variance and standard deviation reveal how widely data points spread around that center. Skewness indicates whether the distribution leans toward higher or lower values, helping analysts detect asymmetry or bias. Together, these metrics offer a quick, reliable way to gauge data balance, identify anomalies, and determine whether transformations are needed to prepare the data for modeling or visualization.
Visual analysis
Visual analysis is one of the most effective techniques in EDA because it transforms abstract numbers into patterns the human eye can quickly interpret. Histograms reveal data distribution and frequency, helping spot skewness or multimodal trends. Scatter plots display relationships between two variables, making it easier to identify correlations, clusters, or outliers. Boxplots summarize data spread and highlight extreme values or inconsistencies across categories. Together, these visuals help analysts detect underlying structures, validate assumptions, and communicate insights clearly to both technical and business audiences.
Correlation and covariance
Analyzing correlation and covariance helps quantify how variables move in relation to one another. Correlation measures the strength and direction of relationships, while covariance indicates whether two variables increase or decrease together. Visual tools like heatmaps present these relationships in colour-coded matrices, allowing analysts to spot strong positive or negative links at a glance. Pairplots go a step further by displaying scatter plots for every variable combination, revealing nonlinear associations and potential redundancies. Understanding these relationships guides better feature selection, reduces multicollinearity, and strengthens the foundation for accurate modeling.
Dimensionality reduction
Dimensionality reduction simplifies complex datasets by reducing the number of variables while preserving their most important information. Techniques like Principal Component Analysis (PCA) identify key components that explain the largest share of variance in the data, making patterns more visible and models more efficient. t-Distributed Stochastic Neighbour Embedding (t-SNE), on the other hand, maps high-dimensional data into two or three dimensions to uncover hidden clusters or relationships. These methods are especially useful when visualizing or modeling datasets with many features, helping analysts focus on what truly drives variation and insight.
Outlier detection
Outlier detection focuses on identifying data points that deviate significantly from expected patterns. These anomalies can signal rare but important events, measurement errors, or shifts in process behaviour. Analysts use statistical techniques like Z-scores, IQR (Interquartile Range), or modified boxplots to flag unusually high or low values, and visual methods such as scatter plots or distribution plots to confirm their presence. Detecting and evaluating outliers early prevents them from skewing averages, distorting correlations, or misleading predictive models, ensuring that subsequent analysis remains accurate and reliable.
Common Challenges in Exploratory Data Analysis
Misinterpreting correlations
A common pitfall in EDA is mistaking correlation for causation. When two variables move together, like sales and marketing spend, it’s tempting to assume one directly drives the other. However, correlations can arise from external factors, hidden variables, or simple coincidence. Overlooking these nuances leads to false conclusions and poorly designed models that fail when applied to new data.
To avoid this, analysts should combine visual correlation checks with domain knowledge and statistical validation. Techniques such as partial correlation, causal inference testing, or controlled experiments help isolate true drivers from coincidental relationships. Annotating findings with context and documenting potential confounding factors ensures that correlations are interpreted as clues for further investigation, not definitive cause-and-effect statements.
Overfitting patterns
Another challenge in EDA is over-interpreting patterns that exist only within the sample data. When analysts explore many variables and combinations, random fluctuations can appear meaningful, leading to “pattern chasing.” This false confidence often results in overfitted models that perform well on historical data but fail in real-world applications.
To counter this, analysts should validate insights using cross-validation, holdout samples, or bootstrapping to confirm that observed relationships persist beyond the initial dataset. Limiting the number of hypotheses tested, emphasizing reproducibility, and consulting domain experts also help distinguish genuine signals from statistical noise.
Ignoring missing data patterns
Treating missing data as random or insignificant is a frequent mistake in EDA. Missing values often reveal data collection issues, biased sampling, or hidden operational problems. Ignoring how and where data is missing may distort distributions, weaken models, and conceal the very insights analysis aims to uncover.
To address this, analysts should first visualize and quantify missingness using heatmaps, missing-value matrices, or percentage summaries. Understanding whether data is missing completely at random (MCAR), at random (MAR), or not at random (MNAR) guides the right handling method, be it imputation, deletion, or data reconstruction. Documenting these choices maintains transparency and prevents downstream bias. Lumi automatically profiles datasets upon upload, visualizing missing-value distributions and suggesting context-aware imputation methods. By surfacing patterns of missingness, it turns what’s often overlooked into actionable diagnostic insight.
Failing to document or reproduce findings
One of the most overlooked challenges in EDA is neglecting to record analytical steps, assumptions, and rationale. When analysts jump from exploration to modeling without proper documentation, teams lose visibility into how insights were derived or why certain decisions were made. This lack of reproducibility complicates collaboration, auditing, and future iterations of the same analysis.
The solution is to treat EDA like a structured experiment. Analysts should maintain analysis logs, use version-controlled notebooks (such as Jupyter or R Markdown), and clearly annotate code, visualizations, and reasoning. Automating report generation and maintaining shared repositories ensure that every finding can be replicated, validated, and built upon with confidence. Lumi captures every step of the analysis automatically. Its version control and shared notebooks ensure that every EDA session is transparent, auditable, and easy to reproduce across teams.
Industry Applications

Supply chain/3PL
Exploratory Data Analysis (EDA) helps supply chain teams detect irregularities in lead times early, improving forecast accuracy and cost control. AWS Supply Chain’s ML-based lead time variability detection enables planners to flag deviations beyond defined tolerances, tightening demand forecasts and inventory alignment. A 2025 study found that integrating anomaly detection reduced forecast error rates and shortened lead times under disruption conditions.
EDA also strengthens operational resilience by surfacing anomalies in real time so teams can react before they escalate into costly disruptions. An MDPI study showed that monitoring lead-time and flow anomalies improves agility and reduces downtime from logistics disruptions. Similarly, an Intelligent Audit report documented how a manufacturer spotted a 50× cost spike in a shipping lane through anomaly detection, preventing further financial exposure.
Retail
Uncovering hidden sales trends via EDA enables retailers to identify incremental revenue opportunities and sharper demand forecasts. A global grocery retailer uncovered 6.8% incremental sales by building models that isolate performance drivers in merchandising and store operations, explaining 86% of sales variance without using historic sales input. In another analysis comparing January 2023 vs January 2022, many retailers saw a 5% year-over-year increase in overall sales, especially in electronics and home goods, and a 15% rise in online sales attributed to shifting consumer behaviour and improved digital experience.
Lumi shows how actionable these insights can become for retail in practice. Chalhoub Group used Lumi to identify customer behaviour signals (purchase frequency, cross-brand activity, resident status) that pointed to a group of online buyers likely to shift one or more purchases to in-store, revealing a $60M revenue growth opportunity by nudging this conversion. This example demonstrates how data exploration with the right tool makes hidden customer-segment trends visible. Another study found that a fashion brand using interactive dashboards saw a 25% increase in sales over six months by tracking inventory and sales trends in real-time, enabling more responsive inventory decisions.
CPG
Optimizing product mix based on customer trend signals enables CPG companies to improve sales and margins meaningfully. A case study of a Fortune-500 CPG showed that optimizing the assortment (i.e. selecting which SKUs and product blends each store should carry) led to a 6% increase in weekly store-level sales via improved product mix and regression‐based demand modelling. Another study reported that real-time analytics and forecasting for mix and trade spend across product segments led to 25% revenue growth and 12% improvement in profit margins within one year when product mix is aligned to performance and customer behaviour.
Lumi demonstrates practical mix-optimization in action too. Sauce Capital, a CPG / food tech hybrid, used Lumi to analyze performance of over 4,500 SKUs, define custom metrics, and generate reports automatically, reducing report building time from days to seconds. That enabled the team to observe product performance trends that might otherwise be overlooked and adjust their mix accordingly for better assortment and margin performance.
AI-enhanced EDA: The Future of Data Exploration
How AI tools accelerate data understanding
AI-powered tools like Lumi are transforming exploratory data analysis (EDA) by automating the most time-consuming parts of data exploration, which are cleaning, summarization, and visualization. Instead of manually generating plots or running summary statistics, Lumi’s AI engine scans datasets, detects correlations, anomalies, and trends, and presents them in interactive visual reports. This dramatically shortens the time from raw data to actionable insights.
Automated summary generation & insight surfacing
AI-driven EDA platforms like Lumi simplify exploration by automatically summarizing key metrics, patterns, and anomalies, turning complex datasets into clear narratives. Using natural language generation, Lumi highlights outliers, correlations, and shifts that might otherwise go unnoticed. Lumi extends this advantage by instantly generating contextual summaries and highlighting hidden drivers behind performance changes, helping teams move from “what happened” to “why it happened” without manual querying.
Natural language querying for EDA
Natural Language Querying (NLQ) lets users explore data conversationally, typing phrases like “show me demand trends last quarter” instead of writing SQL. A 2023 survey found that NLQ dramatically boosts BI accessibility by helping non-technical users query and visualize data easily. Lumi enhances this advantage by allowing users to interact with complex datasets conversationally, turning plain-language questions into instant analytical outputs. Its natural language querying (NLQ) capability empowers non-technical teams to explore trends, detect anomalies, and surface insights on demand, without writing SQL or relying on analysts.
Human + AI collaboration
Human-AI collaboration in EDA merges computational efficiency with human intuition, allowing analysts to focus on interpreting insights rather than cleaning or querying data. In practice, tools like Lumi amplify this synergy, just like how its integration at Sauce Capital automated complex SQL generation, cutting report creation time by 20x and freeing analysts to focus on interpreting trends and validating insights, not coding queries.
Lumi AI and EDA: Self-service EDA inside enterprise analytics platforms
The future of EDA is shifting toward fully self-service analytics ecosystems, where business users can explore, visualize, and interpret data without relying on technical teams. This trend is driven by the demand for agility, as enterprises that democratize analytics see 5x faster decision cycles and 30% higher data adoption rates among employees. Lumi AI embodies this future: by embedding no-code querying and instant visualization into enterprise systems like SAP and Snowflake, Lumi enables teams to perform full-scale EDA through natural language, turning every user into a data explorer.
Exploratory Data Analysis (EDA) forms the foundation of intelligent decision-making in modern enterprises, however, traditional methods still demand extensive manual queries, visual checks, and repeated data validation.
Lumi AI’s Metametrics redefines this process, bringing automation, transparency, and intelligence to the heart of data exploration. By instantly surfacing column-level insights, flagging anomalies, and providing ready-to-use data context, Lumi transforms how teams understand, trust, and act on their data. This shift marks a new era of AI-powered EDA, where analysts focus on interpretation and strategy while Lumi handles the grunt work of data profiling and validation. For enterprises ready to modernize their analytics stack, tools like Lumi don’t just make exploration faster, they make it smarter.
Discover how Lumi AI can help your organization explore, understand, and act on data with speed and confidence. Book a demo today!

Maria is a data analyst turned content writer with a strong foundation in data analytics. With her unique blend of technical expertise and creative flair, she specializes in transforming complex concepts into engaging, accessible content that resonates with both technical and non-technical audiences.
.avif)
.avif)

The New Standard for Analytics is Agentic
Make Better, Faster Decisions.

