
Data Analytics
The Future of Big Data Analytics Solutions

Big data analytics refers to the process of uncovering meaningful patterns and insights from vast, complex, and constantly changing datasets. These datasets are massive in scale, often combining structured information such as transaction records with unstructured sources like text, images, and sensor readings. They also move quickly, streaming in from digital interactions, connected devices, and enterprise systems in real time.
Enterprises once depended on static dashboards and SQL-heavy workflows to access their data. But with the amount of data that companies today store and process, these systems are too limited, and require specialist knowledge to extract information.
As the scale and complexity of data has grown, many organisations have moved toward more automated and interconnected data environments that reduce the need for constant human intervention and make analysis faster and more accessible.
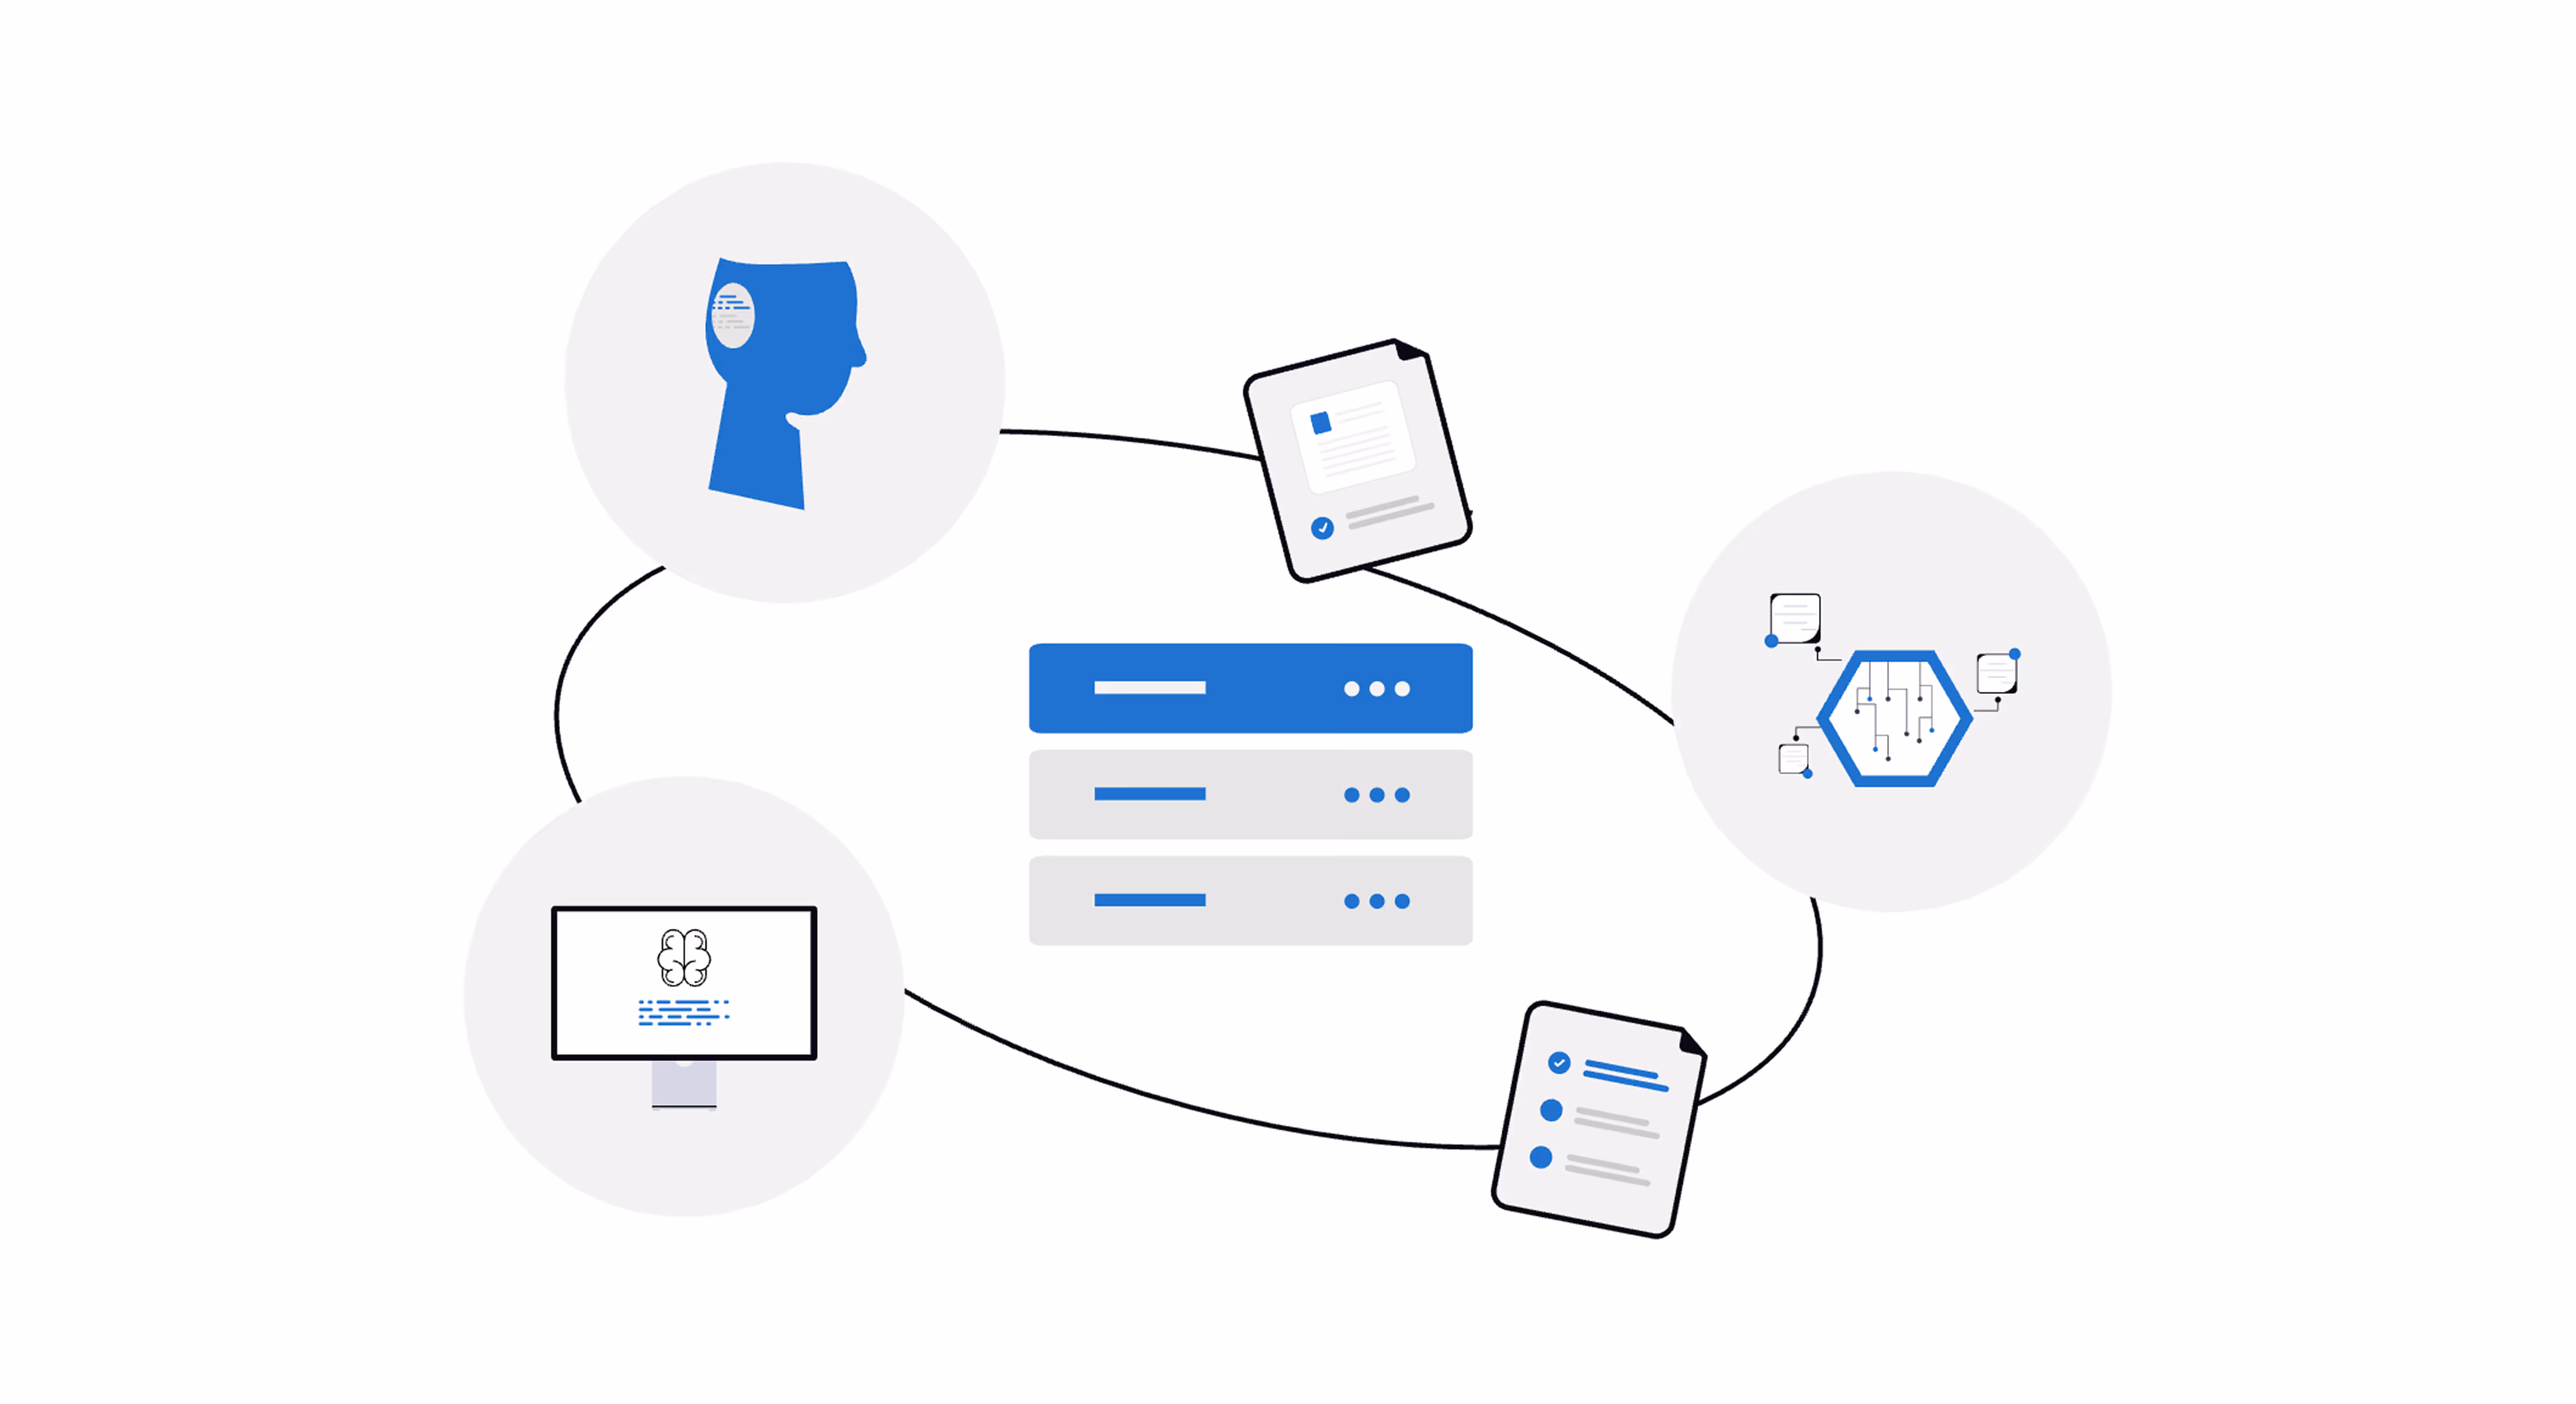
This shift has led to the emergence of intelligent data ecosystems: integrated, AI-enabled environments that connect every stage of the analytics process, from data ingestion and transformation to insight generation and visualisation.
The Traditional Approach
Traditionally organisations have relied on a traditional multi-layered architecture for big data analytics. Data moved through a step-by-step process from its raw source through ingestion, storage, processing, and finally to visualisation.
1. Data sources
Data is the raw material that fuels insight, and every analytics process begins here. Typical sources include transactional systems such as finance or sales databases, customer relationship management platforms, website and app activity logs, and connected devices. Each source has its own structure, speed, and level of quality, which makes unifying them a complex task.
2. Data ingestion
The ingestion process involves building reliable pathways between disparate data sources and the core data platform. It ensures that information flows where it needs to go in the correct format and sequence for later use.
3. Data storage
After ingestion, data needs a home. In traditional architectures, enterprises relied on a combination of data warehouses and data lakes, each serving a distinct purpose:
- A Data warehouse (e.g., Snowflake, Amazon Redshift, Google BigQuery) is used for structured, organised data that is optimised for querying and analysis.
- A Data lake (e.g., Hadoop Distributed File System, AWS S3) is used for raw, unprocessed data of any type: structured, semi-structured, or unstructured.
4. Data processing
Processing transforms raw data into something usable. It involves cleaning and standardising inputs, combining datasets, and performing the calculations that generate insights. This is the most computation-heavy stage and historically required frameworks such as Hadoop and Spark, which distribute workloads across multiple machines to handle scale.
5. Data visualization
The final stage is where analysis becomes accessible to decision-makers. Processed data is presented through visualisation tools such as Tableau, Power BI, or Qlik, which convert tables and models into dashboards, graphs, and interactive reports. These tools allow users to explore data dynamically, filter results, and identify patterns. Business intelligence analysts typically oversee this layer, translating technical data outputs into clear visuals that support operational and strategic decisions.
In traditional big data analytics architecture, each layer depends on its own specialised tools, infrastructure, and teams. While this stack can be extremely powerful, its complexity often creates problems like data silos, integration bottlenecks, and limited real-time visibility.
These challenges have driven the shift toward unified, end-to-end platforms that integrate ingestion, storage, processing, and visualisation within a single environment, enabling faster, more connected, and increasingly AI-driven insights.
The Evolving Landscape of Big Data Solutions
Within these new platforms, particular attention is paid to the processing and consumption layers. These are the stages where raw data is transformed and made actionable and where organizations extract real business value.
Modern Data Platform Layer
The Modern Data Platform Layer forms the operational backbone of analytics. It’s where raw, often unstructured data is transformed into usable formats. Modern systems such as Snowflake, Databricks, BigQuery, and Microsoft Fabric blur the traditional boundaries between storage, compute, and processing, unifying these functions within scalable cloud environments that handle vast volumes and varieties of data efficiently.
Apache Hadoop and Apache Spark
These open-source frameworks underpin large-scale distributed computing. Hadoop pioneered the ability to process vast datasets across clusters of machines, while Spark extended that capability with in-memory processing for faster performance. Together, they remain the foundation for batch and streaming workloads in many enterprise environments.
Snowflake
A cloud-native data warehouse, Snowflake separates compute from storage, allowing organizations to scale each one independently. This architecture enables high concurrency (multiple teams querying at once) and rapid, cost-efficient analytics on massive datasets.
Databricks
Built around the Lakehouse concept, Databricks merges data engineering, analytics, and machine learning in one collaborative platform. It allows teams to prepare, process, and analyze data within a single environment, reducing duplication and friction between specialized tools.
Google BigQuery
BigQuery is a serverless, fully managed data warehouse that emphasizes elasticity and speed. It allows teams to query terabytes of data in seconds without worrying about infrastructure management, making it a cornerstone of Google Cloud’s analytics stack.
Amazon Redshift
AWS’s data warehouse service, Redshift, is optimized for fast querying and scalable analytics. It integrates closely with the wider AWS ecosystem, allowing seamless data movement between storage, compute, and reporting layers.
Microsoft Fabric / Synapse Analytics
Microsoft’s unified analytics platform brings together data integration, warehousing, and engineering in one environment. Fabric (and its predecessor Synapse) reduce complexity by enabling end-to-end workflows across Azure-based data estates.
Snowplow and Fivetran
These tools focus on data ingestion and pipeline automation. Snowplow specializes in collecting and structuring behavioral data from digital sources, while Fivetran automates data movement from applications and databases into central warehouses, ensuring consistency and freshness.
Apache Airflow and dbt
These tools handle workflow orchestration and transformation. Airflow schedules and monitors ETL pipelines, while dbt (data build tool) structures transformation logic in a modular, reusable way, promoting transparency and version control in analytics projects.
This layer ensures data is accurate, accessible, and performant, forming the foundation for meaningful analysis in the next stage.
Consumption & Insight Layer
.avif)
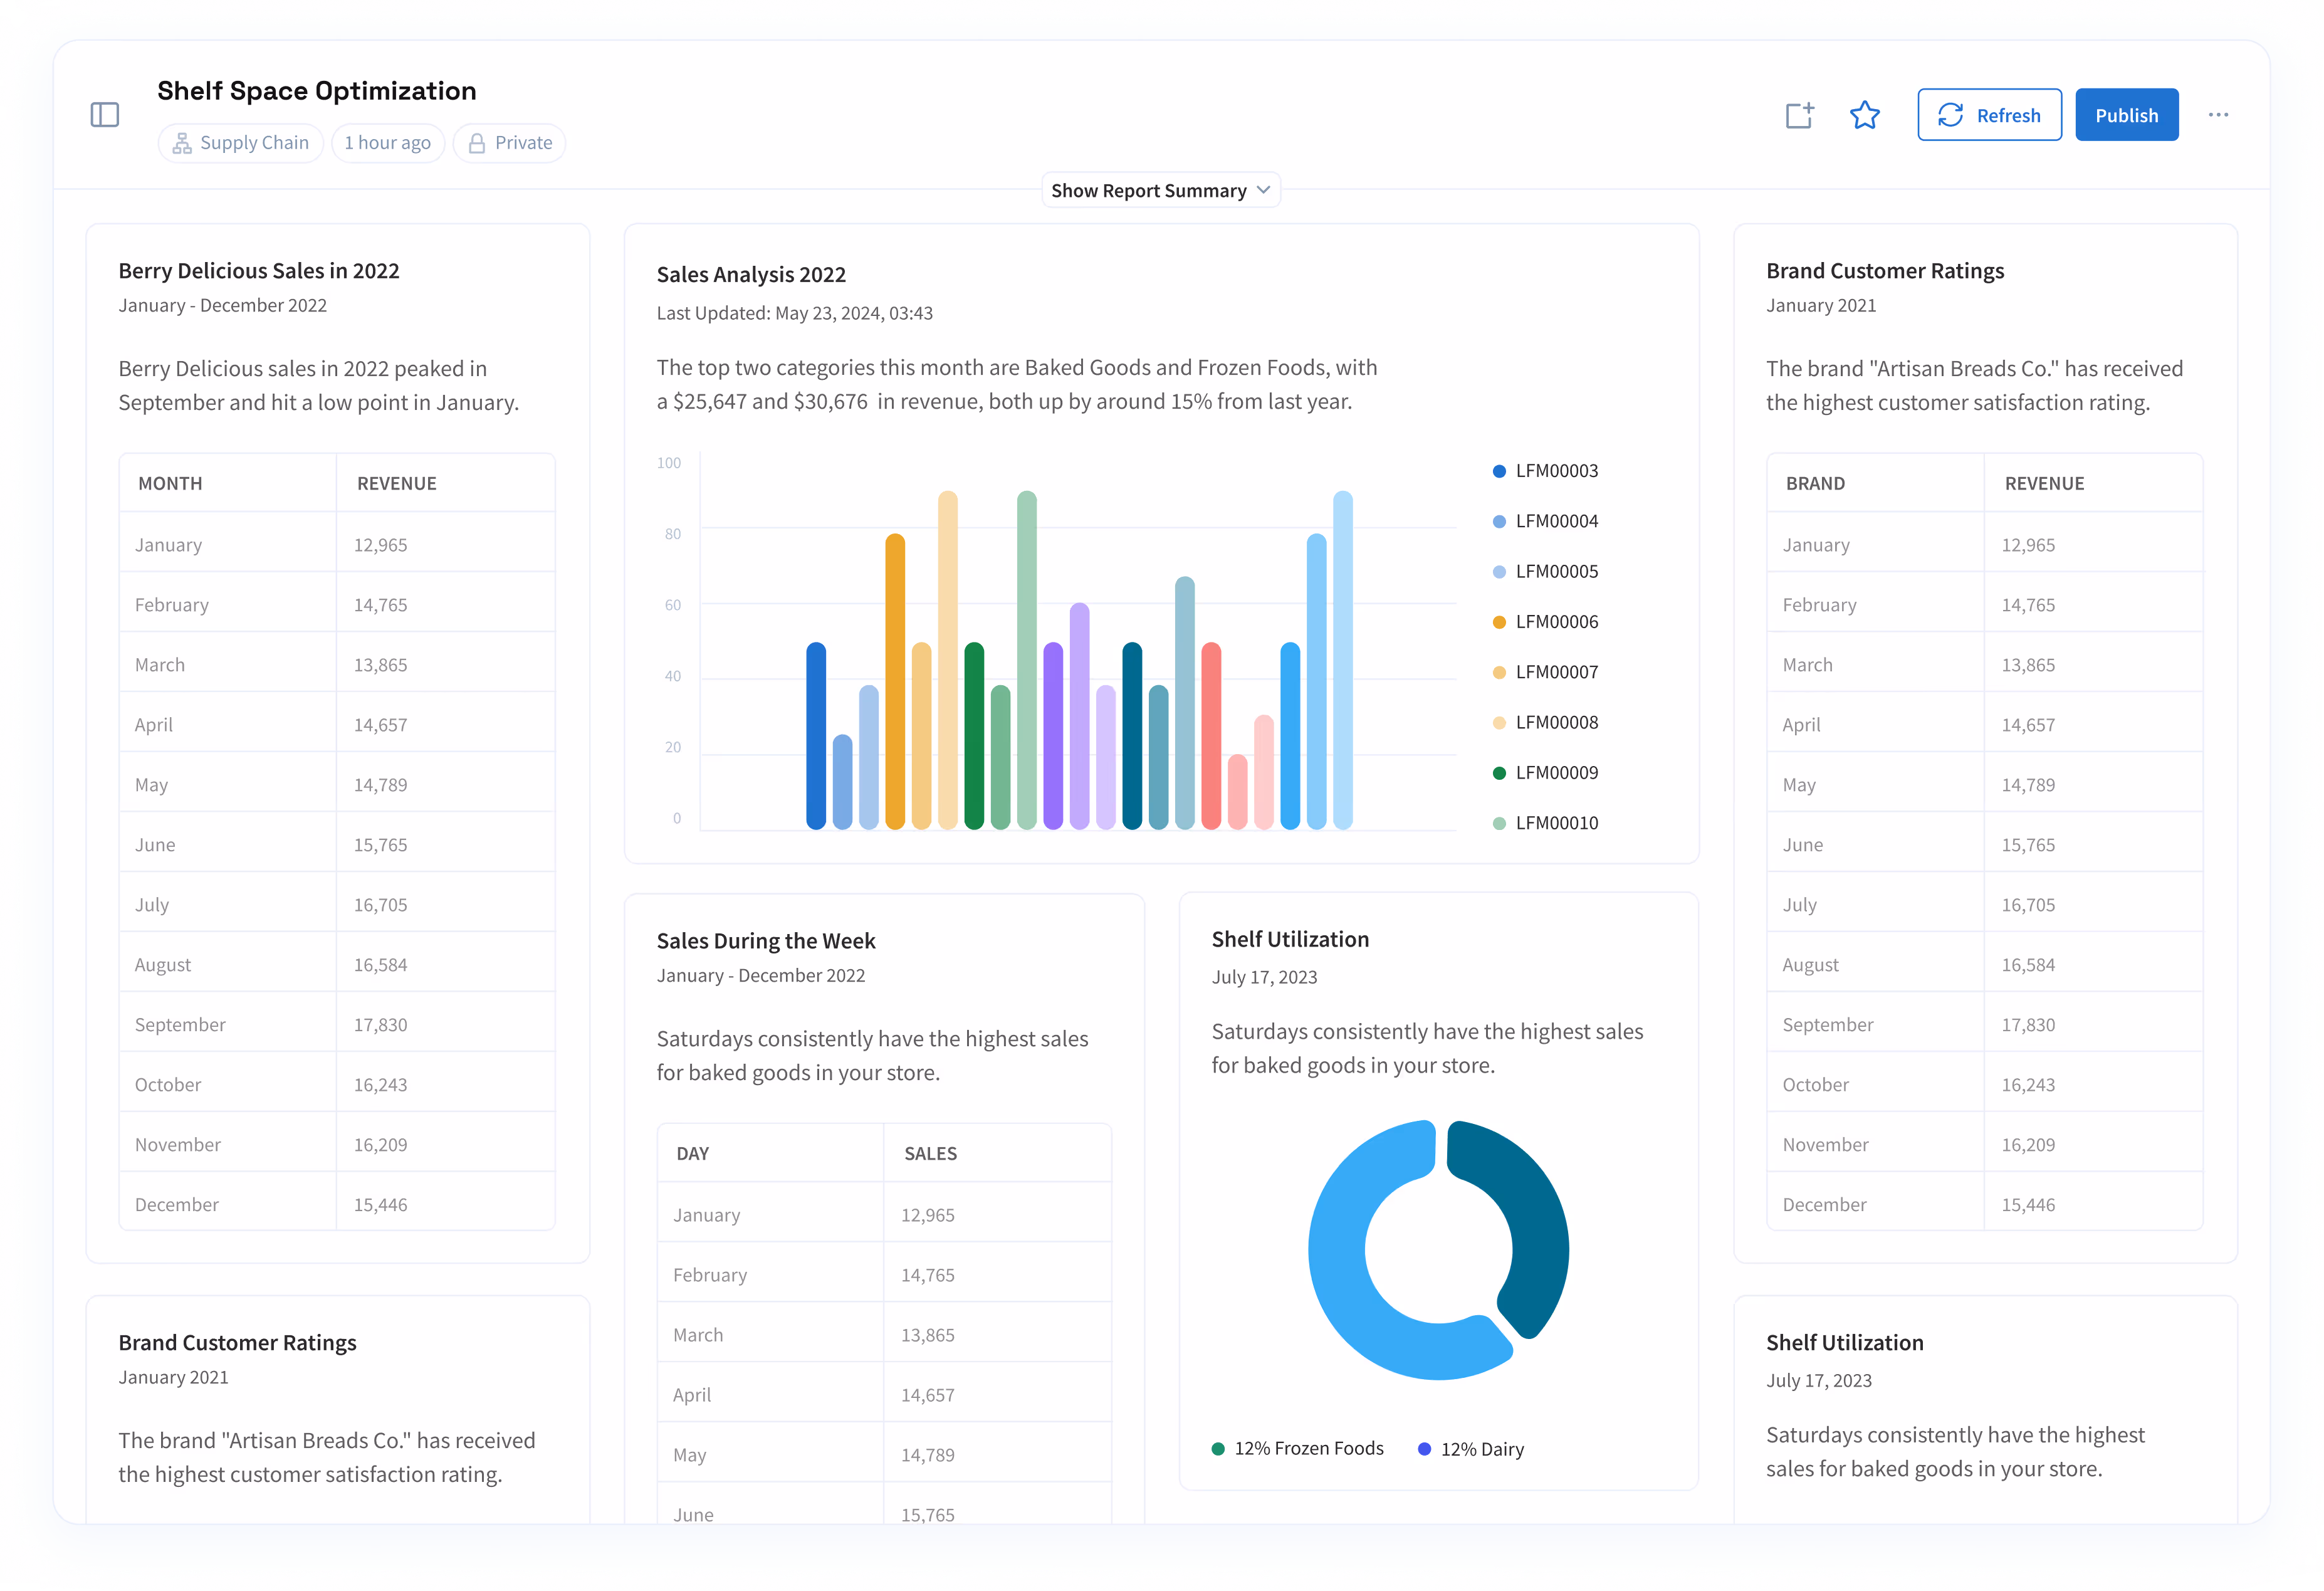
Once data is processed and modeled, the Consumption Layer turns it into insight. These tools enable everyone from analysts to executives to visualize trends, explore questions, and make informed decisions. Increasingly, this layer is being reshaped by AI and natural language interfaces that remove barriers between data and understanding.
Tableau and Power BI
The established leaders in business visualization and dashboarding, Tableau and Power BI allow users to build interactive reports, explore data visually, and drill into performance metrics. They remain central to enterprise reporting workflows.
ThoughtSpot
ThoughtSpot introduced search-driven analytics, enabling users to ask questions in natural language and receive instant visual answers. It marked an early move toward self-service BI, reducing reliance on technical analysts.
Sigma Computing
Sigma brings a spreadsheet-like interface directly onto cloud data warehouses, making data exploration familiar to business users. It allows analysis at warehouse scale without SQL, bridging the gap between technical capability and accessibility.
Omni
Omni combines governed data models with flexible visualization, giving organizations a balance between self-service analytics and central oversight. It reflects a trend toward tools that respect data governance while promoting agility.
Lumi AI
As an AI-native analytics platform, Lumi connects directly to enterprise data warehouses and enables natural language interaction. By automating insight generation and supporting collaborative, no-code exploration, Lumi surfaces anomalies, trends, and context automatically.
Its AI-powered interface allows users to generate insights, ask questions in natural language, and collaborate across teams, removing the need for multiple separate tools and helping organizations make faster, smarter decisions
Modern analytics platforms are increasingly designed to streamline workflows and make insights accessible across teams, reducing the reliance on specialized technical roles while enabling faster, more informed decision-making.
Case Snapshots: Turning Complexity into Clarity
Across industries, the promise of big data has always been clear, but the challenge lies in turning that data into decisions fast enough to matter. Two examples from Lumi AI’s enterprise clients show what’s possible when AI-powered analytics sit directly at the point of insight.
From Insight to Action at Chalhoub Group
Chalhoub Group, one of the Middle East’s largest luxury retailers, wanted to better understand how digital behaviors influenced in-store purchases. Using Lumi AI, the company analyzed vast customer datasets spanning both physical and online channels. Within days, Lumi surfaced patterns that revealed which shoppers were most likely to move from browsing online to buying in-store, uncovering a $60 million growth opportunity.
More importantly, these findings allowed teams across marketing, retail, and digital commerce to align around the same insight. Instead of waiting weeks for manual reports, they could test hypotheses, refine campaigns, and adapt in real time, guided by a clear picture of what was driving sales at the ground level.
Uncovering Hidden Demand at Kroger
Kroger, one of the world’s largest grocery retailers, uncovered the equivalent of nearly a million dollars of unmet demand when it used Lumi AI to analyze discrepancies between store orders and distribution shipments. The platform pinpointed where supply wasn’t meeting demand, revealing hidden product and assortment opportunities that traditional analysis had overlooked.
By surfacing these insights instantly, Lumi enabled Kroger’s teams to adjust their inventory strategies, refine assortments, and capture sales that would have otherwise slipped through the cracks.
Implications
- Automated insight generation: Lumi’s ability to analyze massive, multidimensional datasets and surface patterns that humans might miss transforms analytics from a reactive task into a continuous discovery process.
- Democratizing analytics: By translating complex queries into natural language and visual stories, Lumi brings analytical power to every department, so insight isn’t confined to data teams but shared across the business.
- Accelerating decision-making: With insights delivered directly where and when they’re needed, organizations can move from diagnosis to action in days, not weeks.
The Future of Big Data Analytics Is AI-Native
Enterprise analytics solutions have evolved from fragmented, tool-heavy stacks into more unified, intelligent ecosystems.
AI-native platforms like Lumi AI represent the next stage in that evolution. By connecting directly to existing data systems and automating the interpretation of results, Lumi eliminates friction and complexity, enabling organizations to focus on decisions rather than dashboards. Scalable, unified, and intelligent by design, it turns data into a living resource that’s accessible to anyone, at any level, in real time.
See how Lumi AI helps enterprise teams turn data into decisions without the complexity.

Anthony Scalzitti is a Value Engineer at Lumi AI, specializing in implementations and customer success. With a background in computer science and experience in AI strategy and analytics, he ensures Lumi’s solutions deliver real impact for customers.
The New Standard for Analytics is Agentic
Make Better, Faster Decisions.

