The agentic analytics platform built for food and beverage supply chains that can't afford inventory surprises.
Lumi connects to your ERP and demand data to surface stockout risks, overstock positions, and supplier issues before they hit your P&L — through a conversational interface anyone can use.

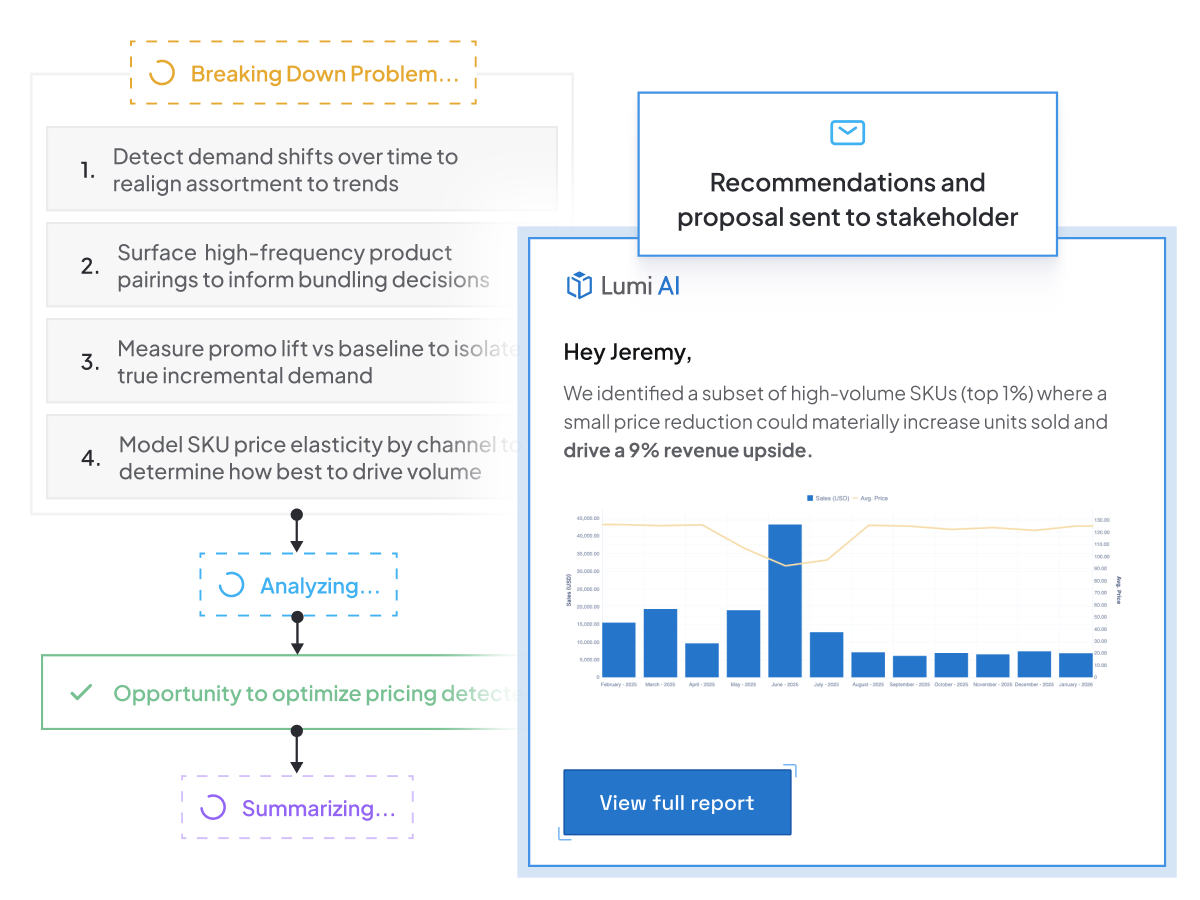
Lumi’s ability to de-average and re-aggregate down to store-item impacts makes it far more efficient.

It was obvious during the pilot that Lumi could take care of a lot of the challenges. You could just ask.
Lumi identified $60M in additional revenue by targeting customers most likely to shift to higher AOV transactions.
F&B supply chain teams use Lumi to cut excess inventory and eliminate stockouts before they happen.
Kroger finds seven figures of unfulfilled demand in OvS
"Lumi's ability to de-average and reaggregate down to store-item impacts makes it far more efficient than anything we had before."
Demand Planning

Chalhoub identifies $60M opportunity to increase AOV
“ We identified a cohort of prime candidates for conversion to omni-channel that were not previously visible.”
Shopper Cohort Analysis

Sapphire reduces material procurement costs by 38%
“Lumi allowed us to improve procurement efficiency by ordering more from cost-effective vendors.”
Procurement Optimization


Weekly reports don't prevent stockouts. Lumi surfaces inventory risks the moment they emerge.
Lumi connects to your ERP, WMS, and demand planning data to give every supply chain decision-maker a real-time view of inventory health — no tickets, no waiting.
- Automatically flag SKUs trending toward stockout by DC or region
- Surface overstock positions before write-downs hit the books
- Give planners self-service access to inventory and turns data
- Run continuous missions to monitor supplier lead time variance
- Share findings and alerts across procurement and ops teams
Agentic analytics empowers the business user to explore & frees up the data team to work strategically
Jordan Kuhns, CIO @ Growmark
The only agentic analytics platform built for supply chain teams who need answers faster than their dashboards.
Lumi connects your supply chain data and proactively surfaces inventory risks, demand shifts, and supplier issues. No more waiting for the weekly report to find out what went wrong.
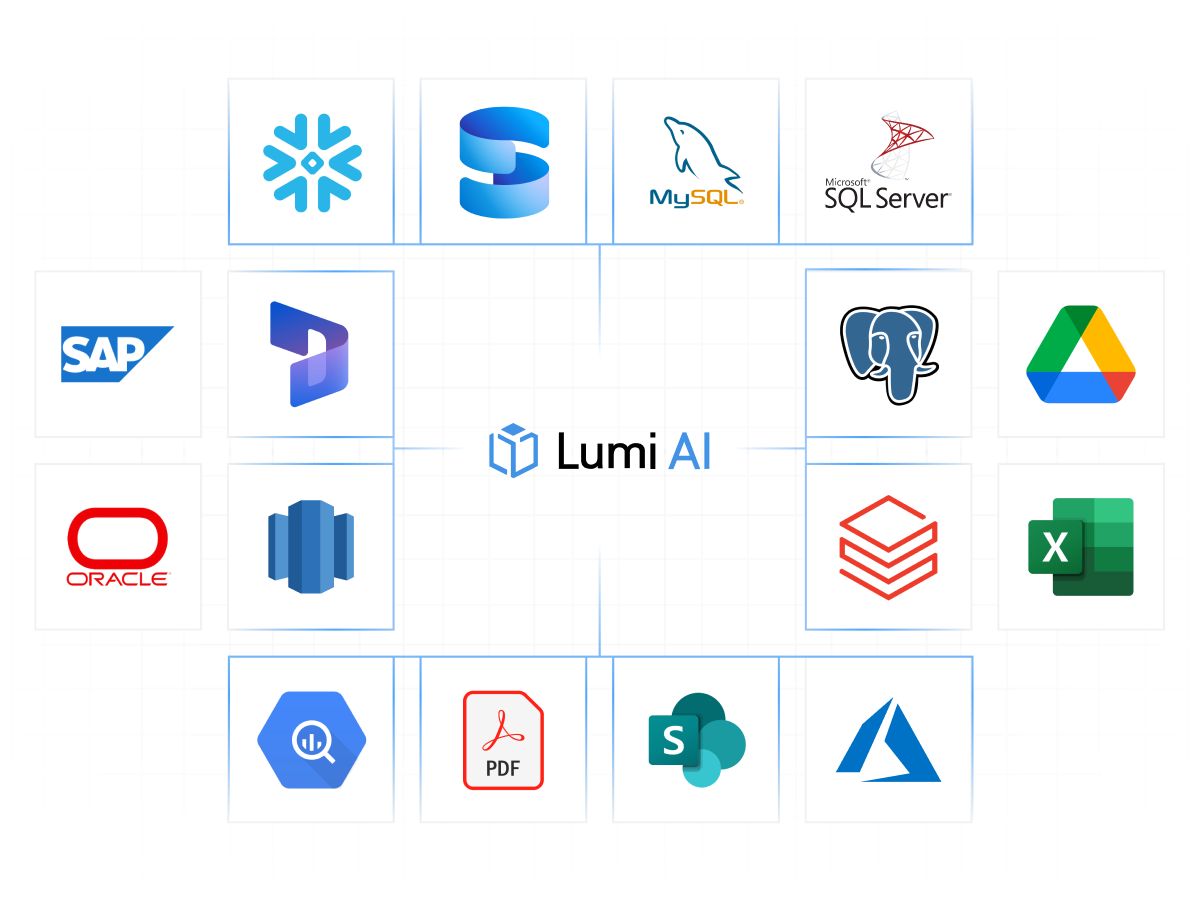
Connect directly to your ERP, WMS, and demand planning tools for instant analysis.
Lumi integrates with SAP, Oracle, NetSuite, and the rest of the modern supply chain stack to help you get to inventory insights faster, no matter where your data lives.
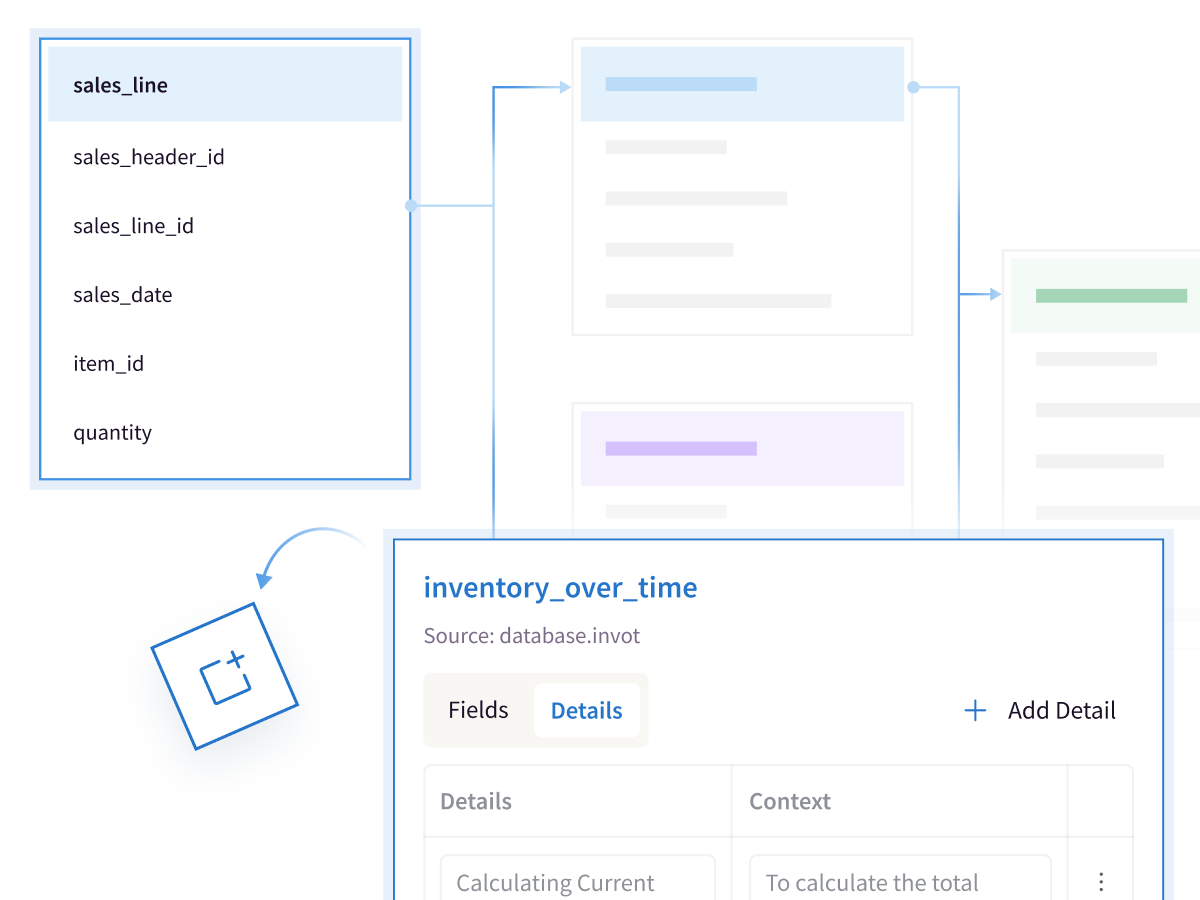
Give planners and ops teams direct access to inventory and turns data.
Lumi's Knowledge Base captures your business rules and SKU hierarchies so every planner can query inventory data in plain language — without waiting on a data analyst.
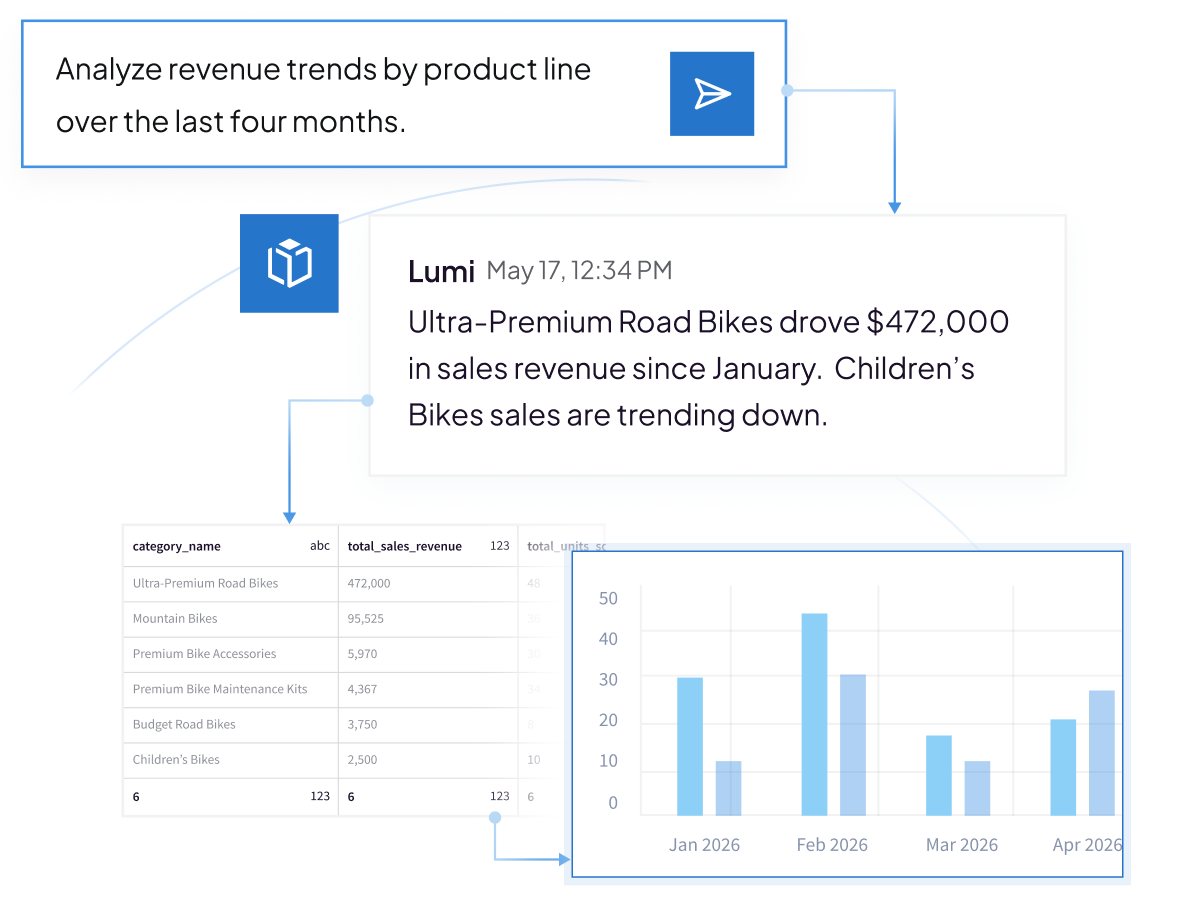
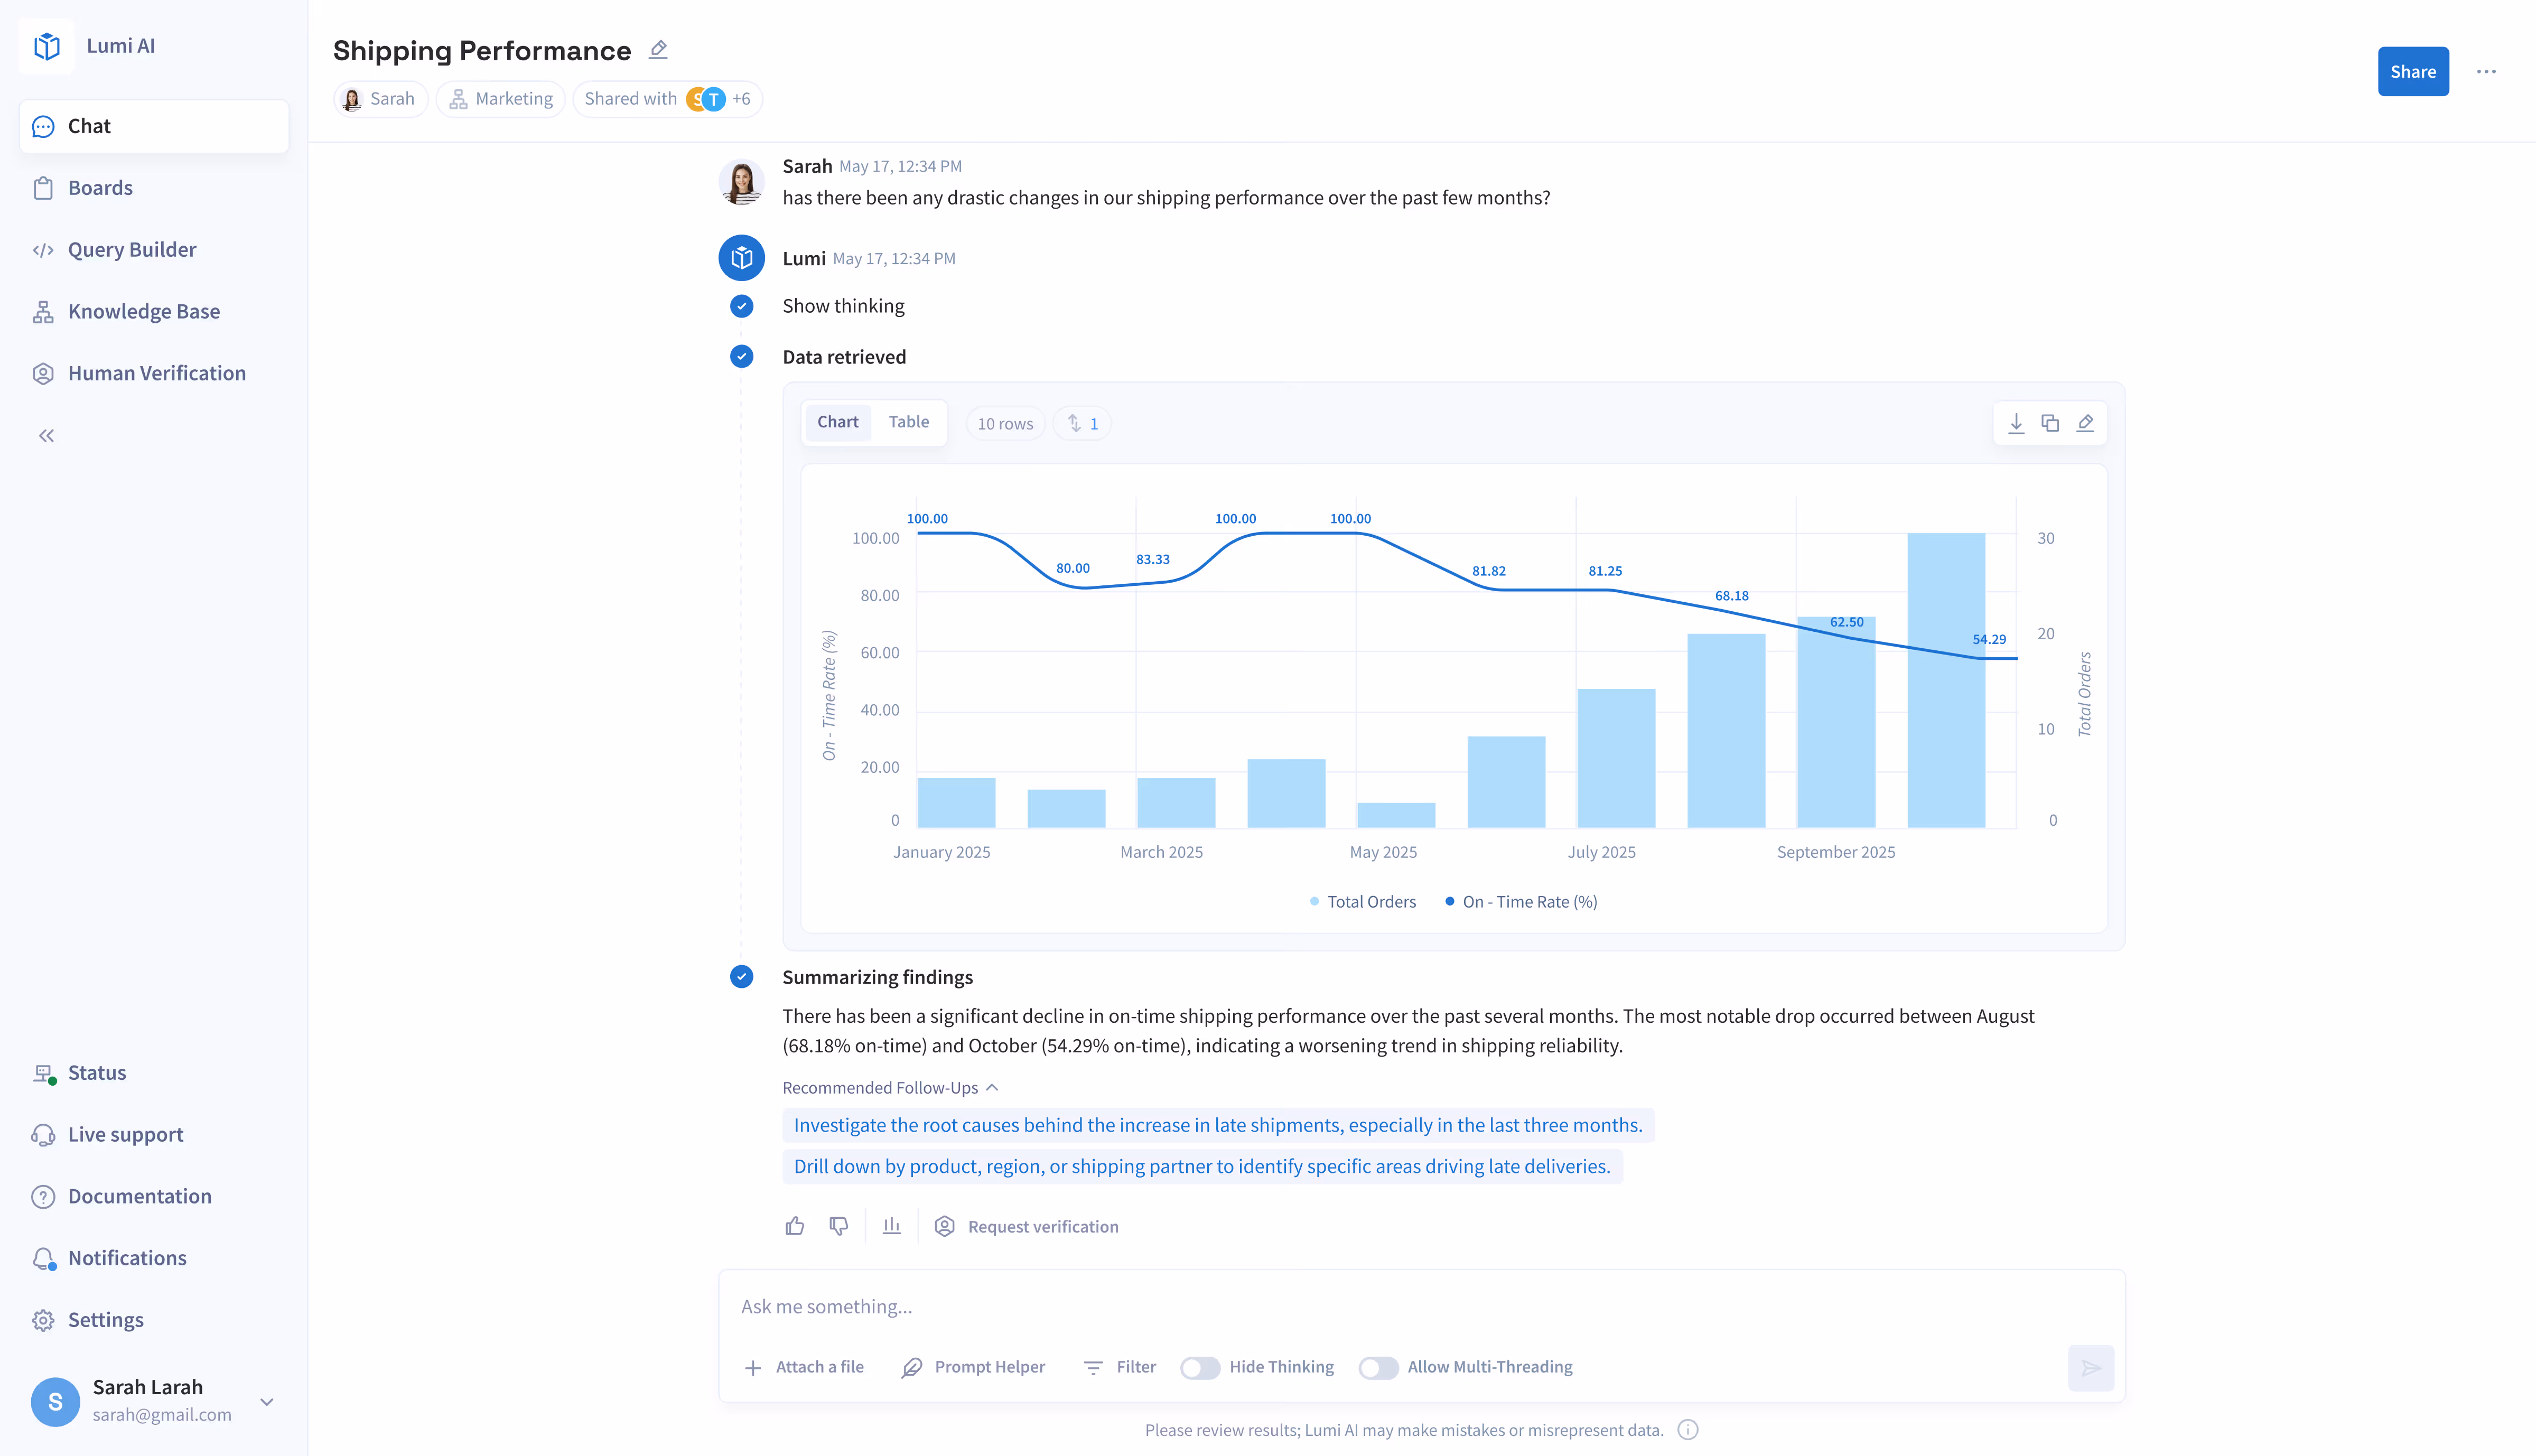
Ask any supply chain question and get a clear, trustworthy answer in seconds.
From days-on-hand by DC to supplier fill rate trends, Lumi lets your team explore inventory data conversationally — and pin findings to share with procurement and finance.
Detect stockout and overstock risks automatically, before they hit your P&L.
Lumi runs continuous missions across your inventory data — flagging at-risk SKUs, monitoring lead times, and delivering findings to the right people without a single manual query.
Which F&B companies lead on inventory intelligence?
Join supply chain teams at food and beverage companies using Lumi to reduce stockouts, cut excess inventory, and stay ahead of demand shifts.
